Aliz AI Survey 2026 Q3 Results

Internal survey · engineering AI adoption · wave 1 vs wave 2
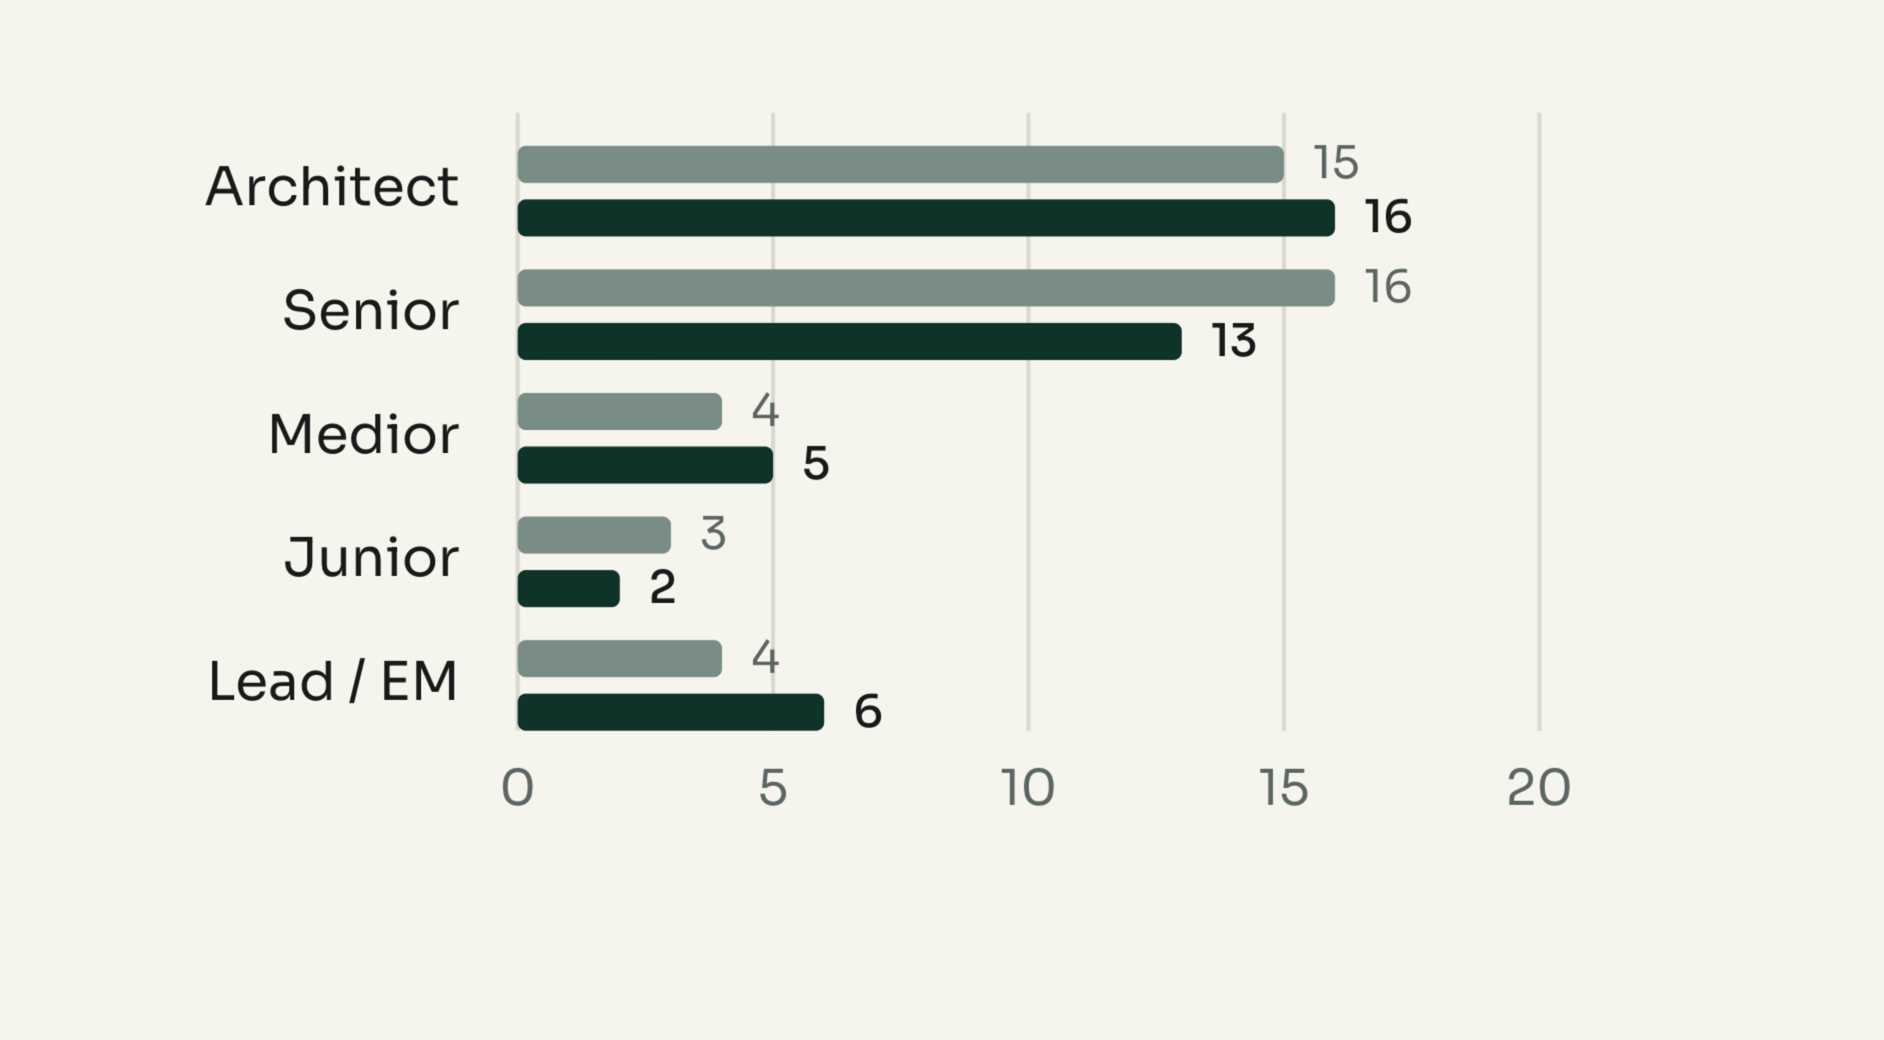
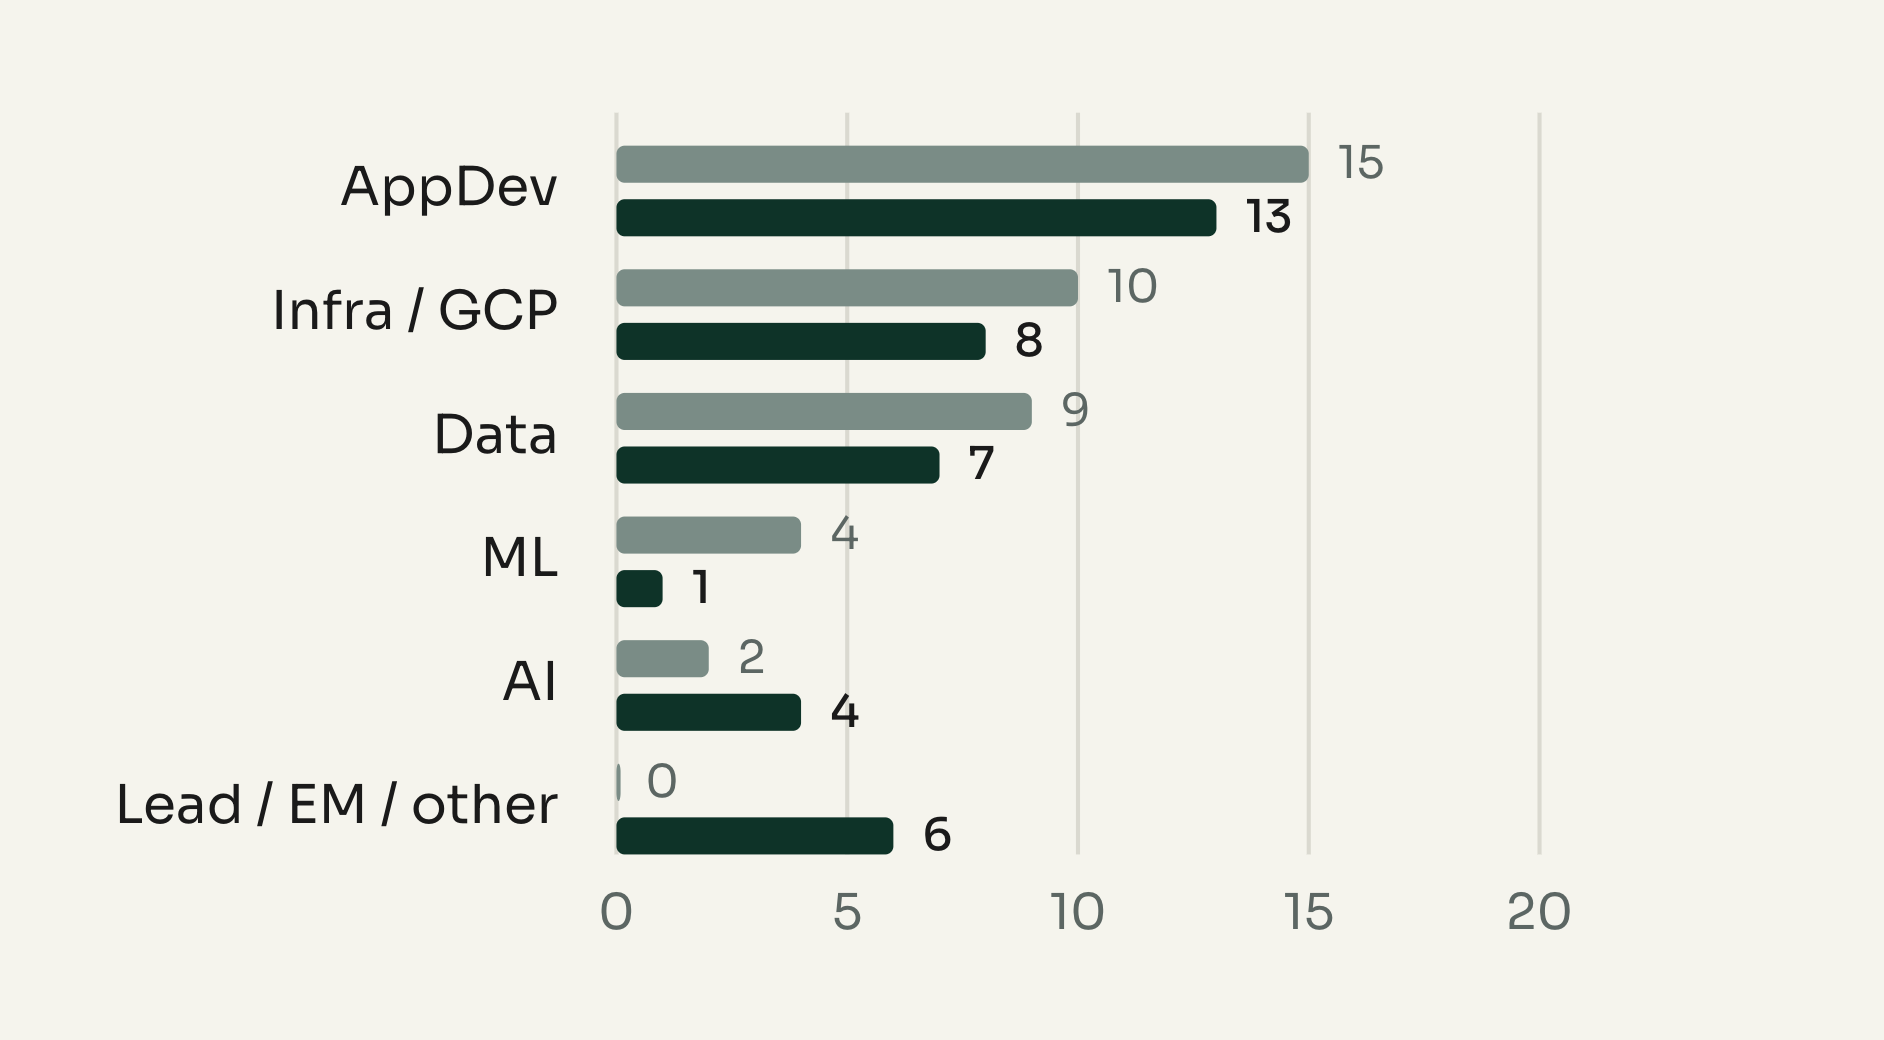
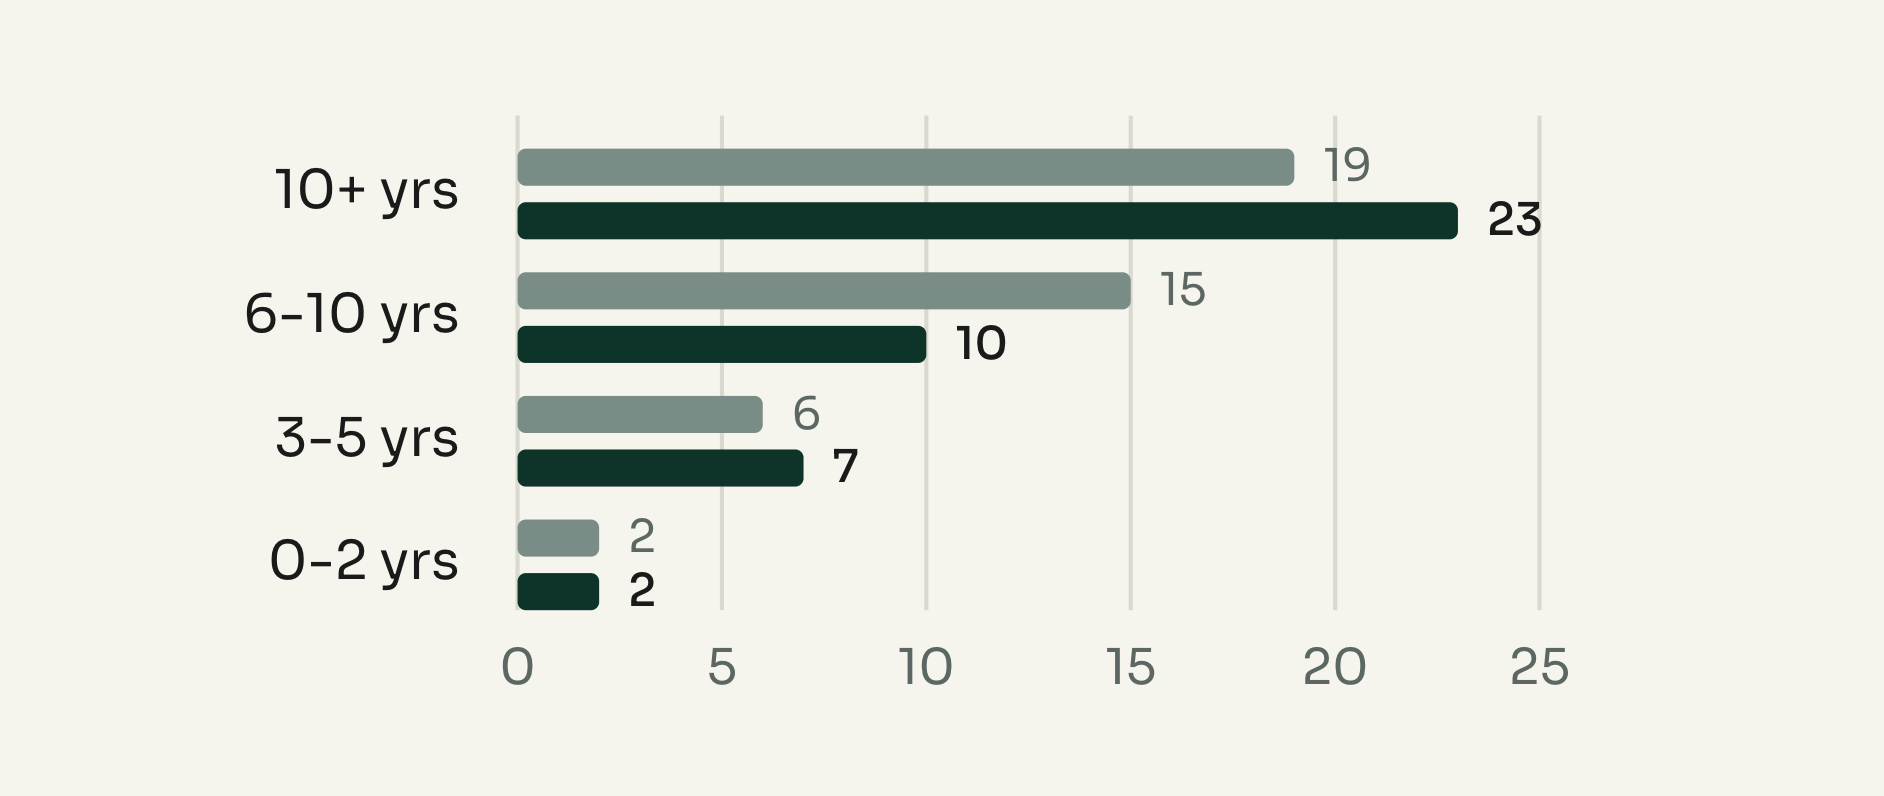
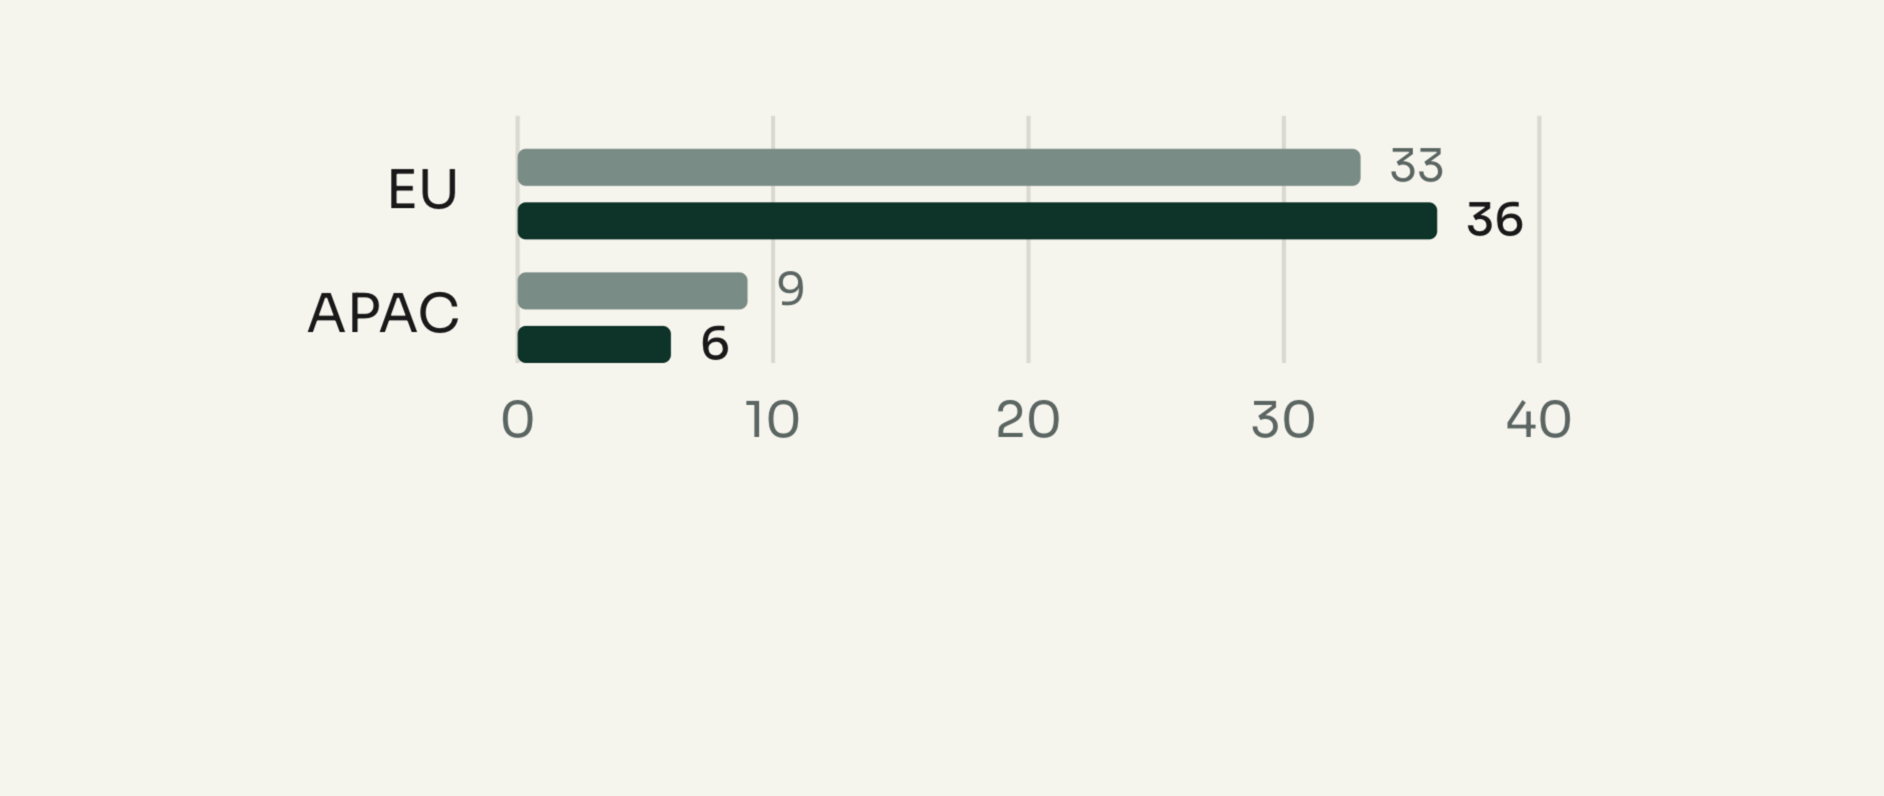
Two identical-sized samples, four months apart. 42 responses in March 2026, 42 in July 2026. Every question in both questionnaires is charted below. Wave 2 added five questions and several new answer options; those are marked in green and have no baseline.
How to read the charts: grey bars = March 2026 · dark‑green bars = July 2026 · bright‑green bars = answer options new in wave 2.
 |  |  |  |
01 — Who answered.
Not a matched panel. Both waves are anonymous and self-selected, so some movement below is composition rather than behaviour change. Wave 2 skews more senior, more European, and introduced a Lead / EM grade that absorbed the previous Lead category.a
| Grade | Track |
|---|---|
 |  |
| Experience | Region |
|---|---|
 |  |
Wave 1 tracks are not perfectly comparable: wave 2 renamed AppDev to "AppDev (frontend, backend)" and moved six people into a Lead / EM bucket that did not exist before.
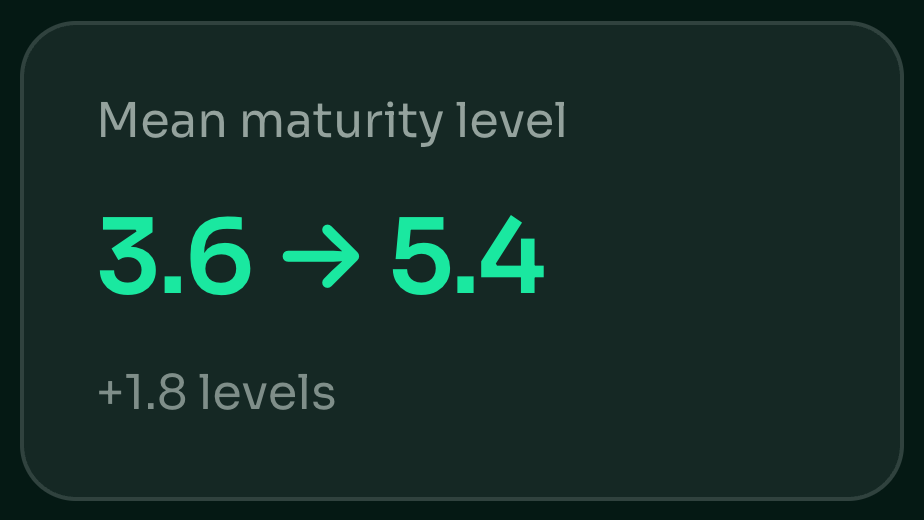
02 — Maturity moved almost two full levels.
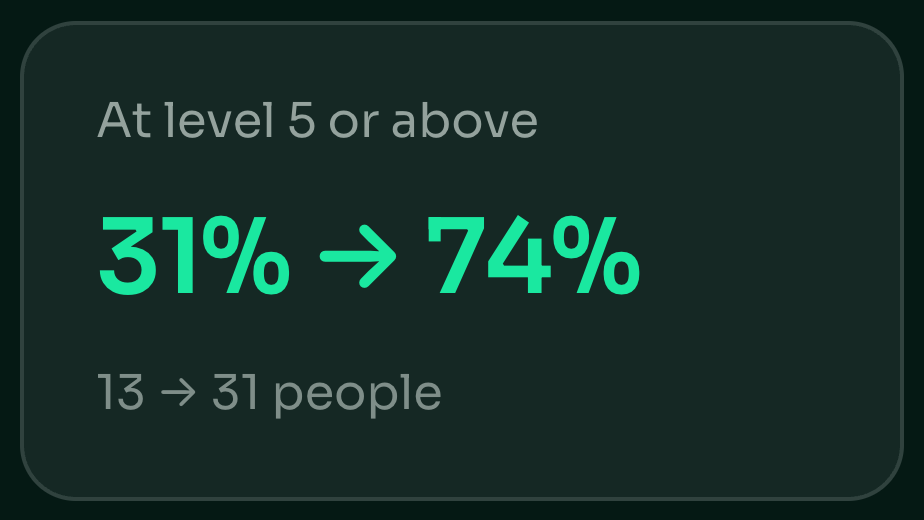
This is the headline. In March the distribution peaked at level 2, cautious assistant. In July it peaks at level 6, multi-agent. Nobody reported level 7 in March; four do now, plus three orchestrators.
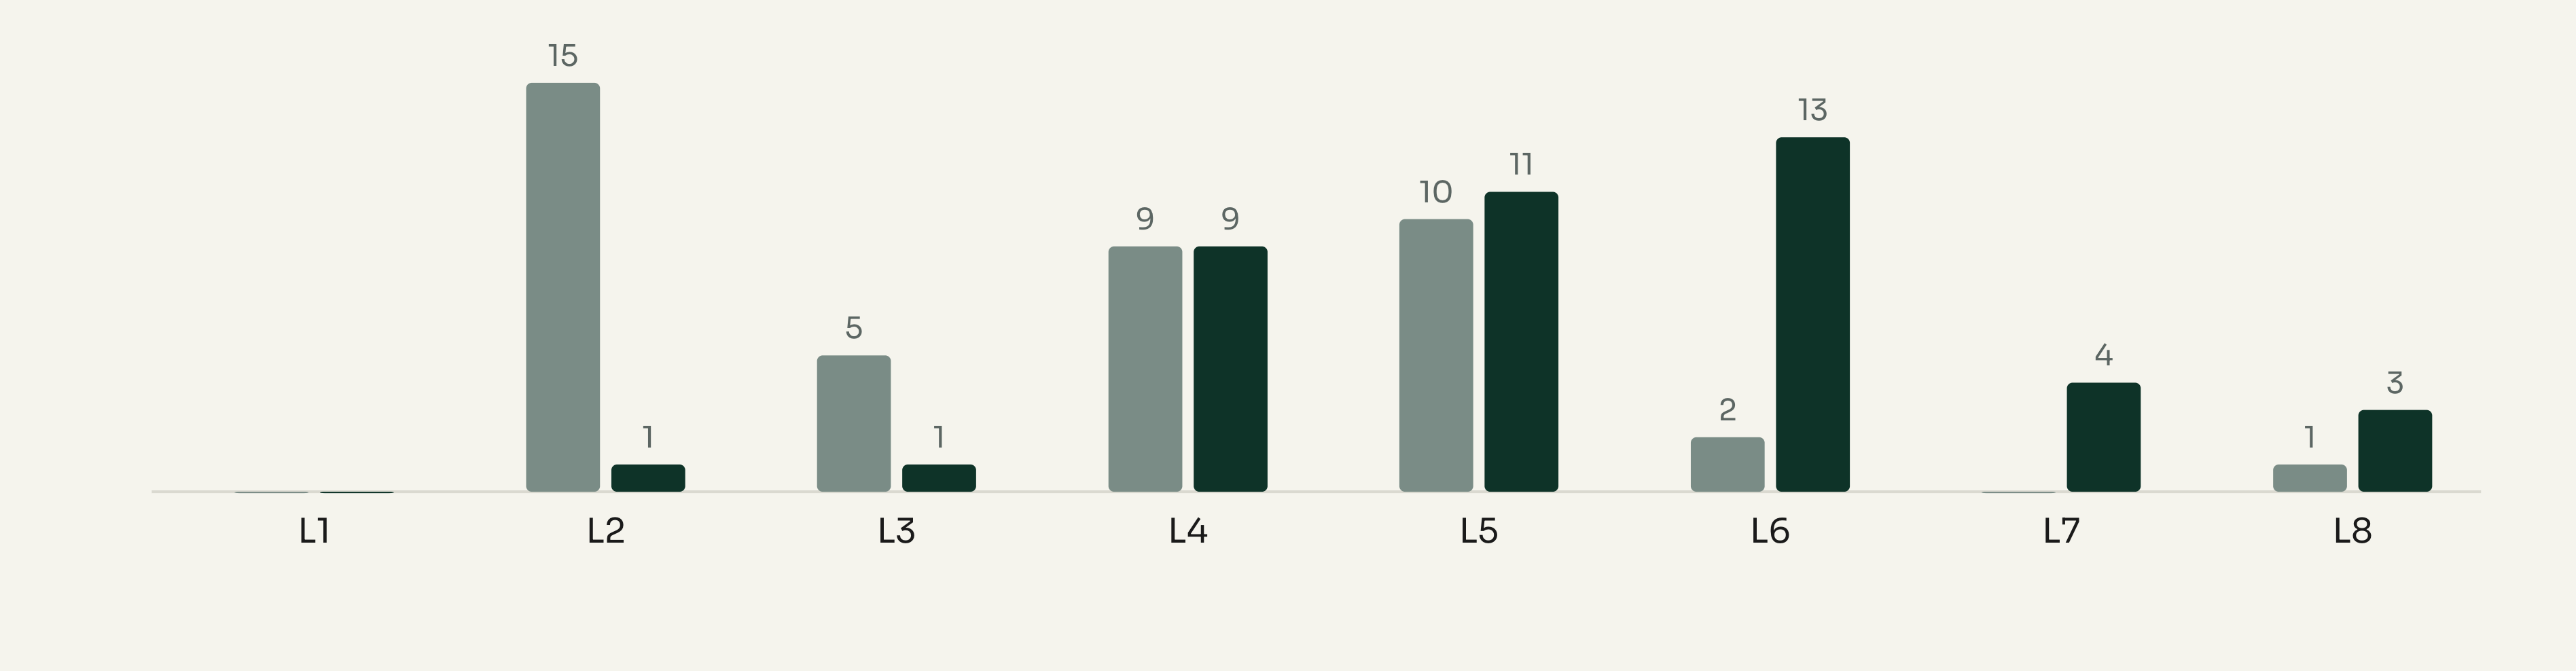
One respondent pushed back on this question directly, arguing the ladder implies IDE work is "low-level" and penalises people who cannot hold context across parallel agents. Worth reading before treating the level as a performance metric.
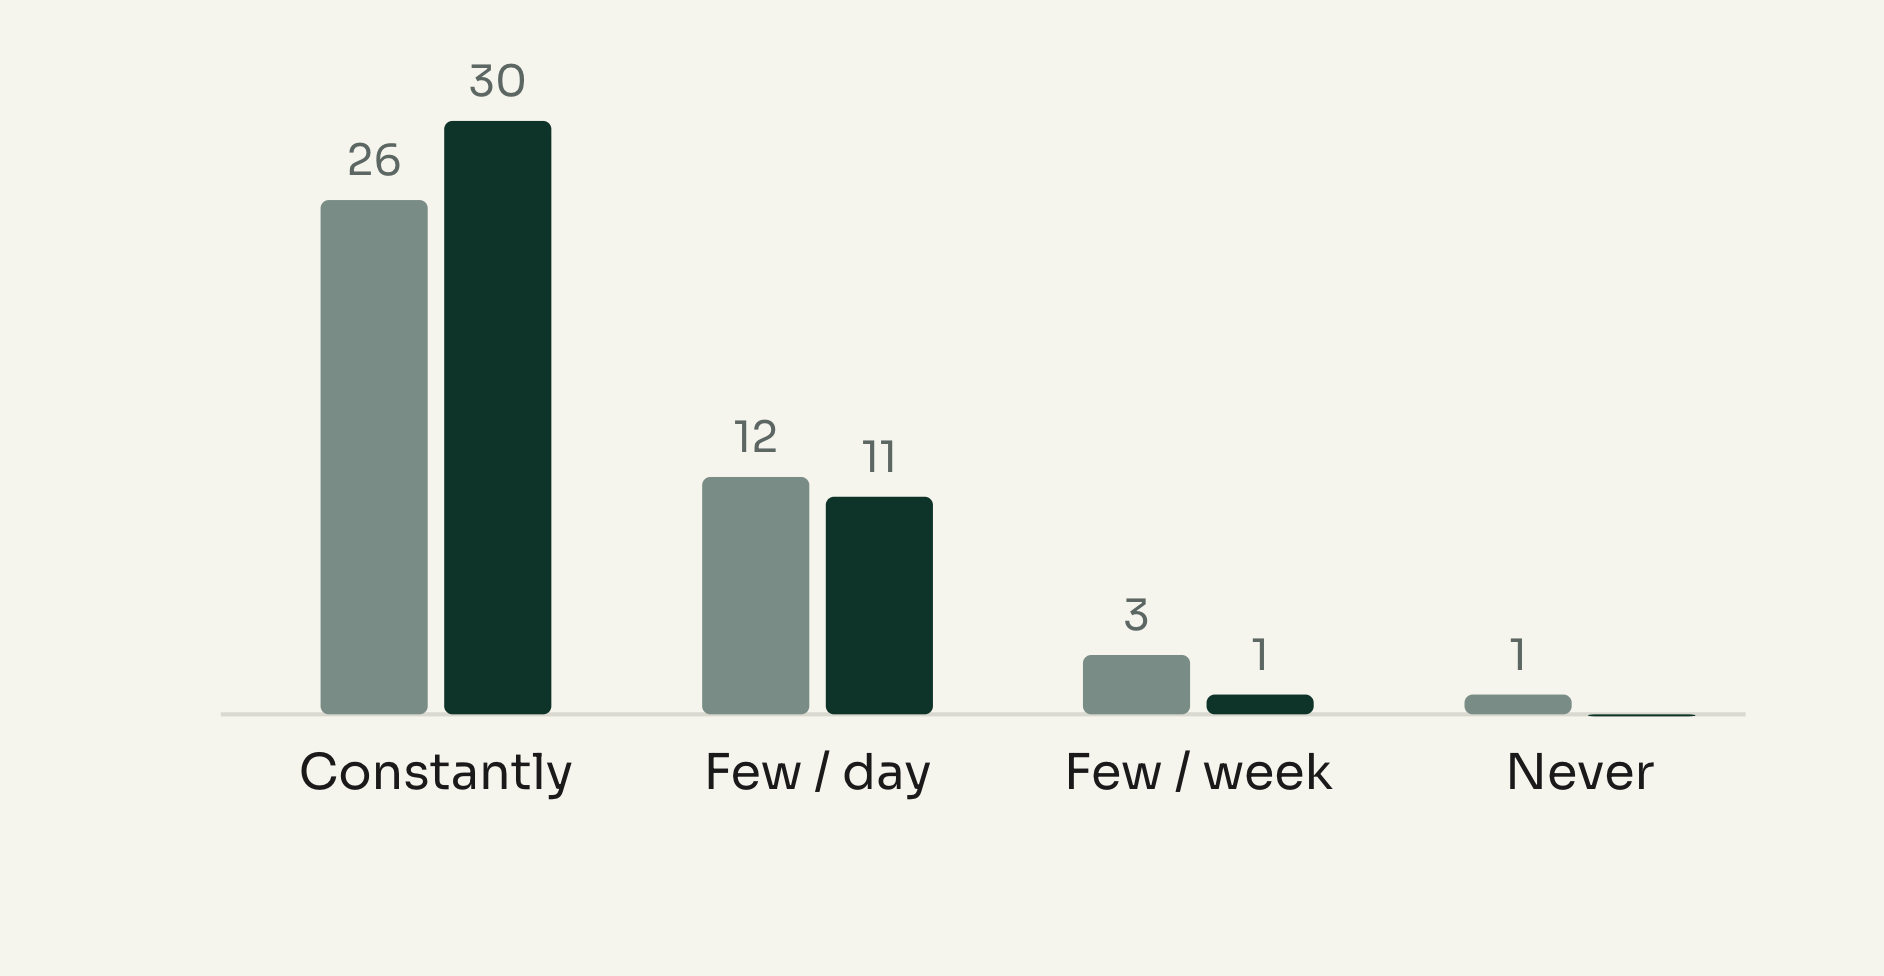
03 — Usage frequency was already saturated.
There was little headroom here. Daily-or-more use went from 90% to 98%. The change is not that more people use AI, it is that the people already using it went much deeper.
| How often during a work day | Confidence to explain and debug own AI code (1–5) |
|---|---|
 | 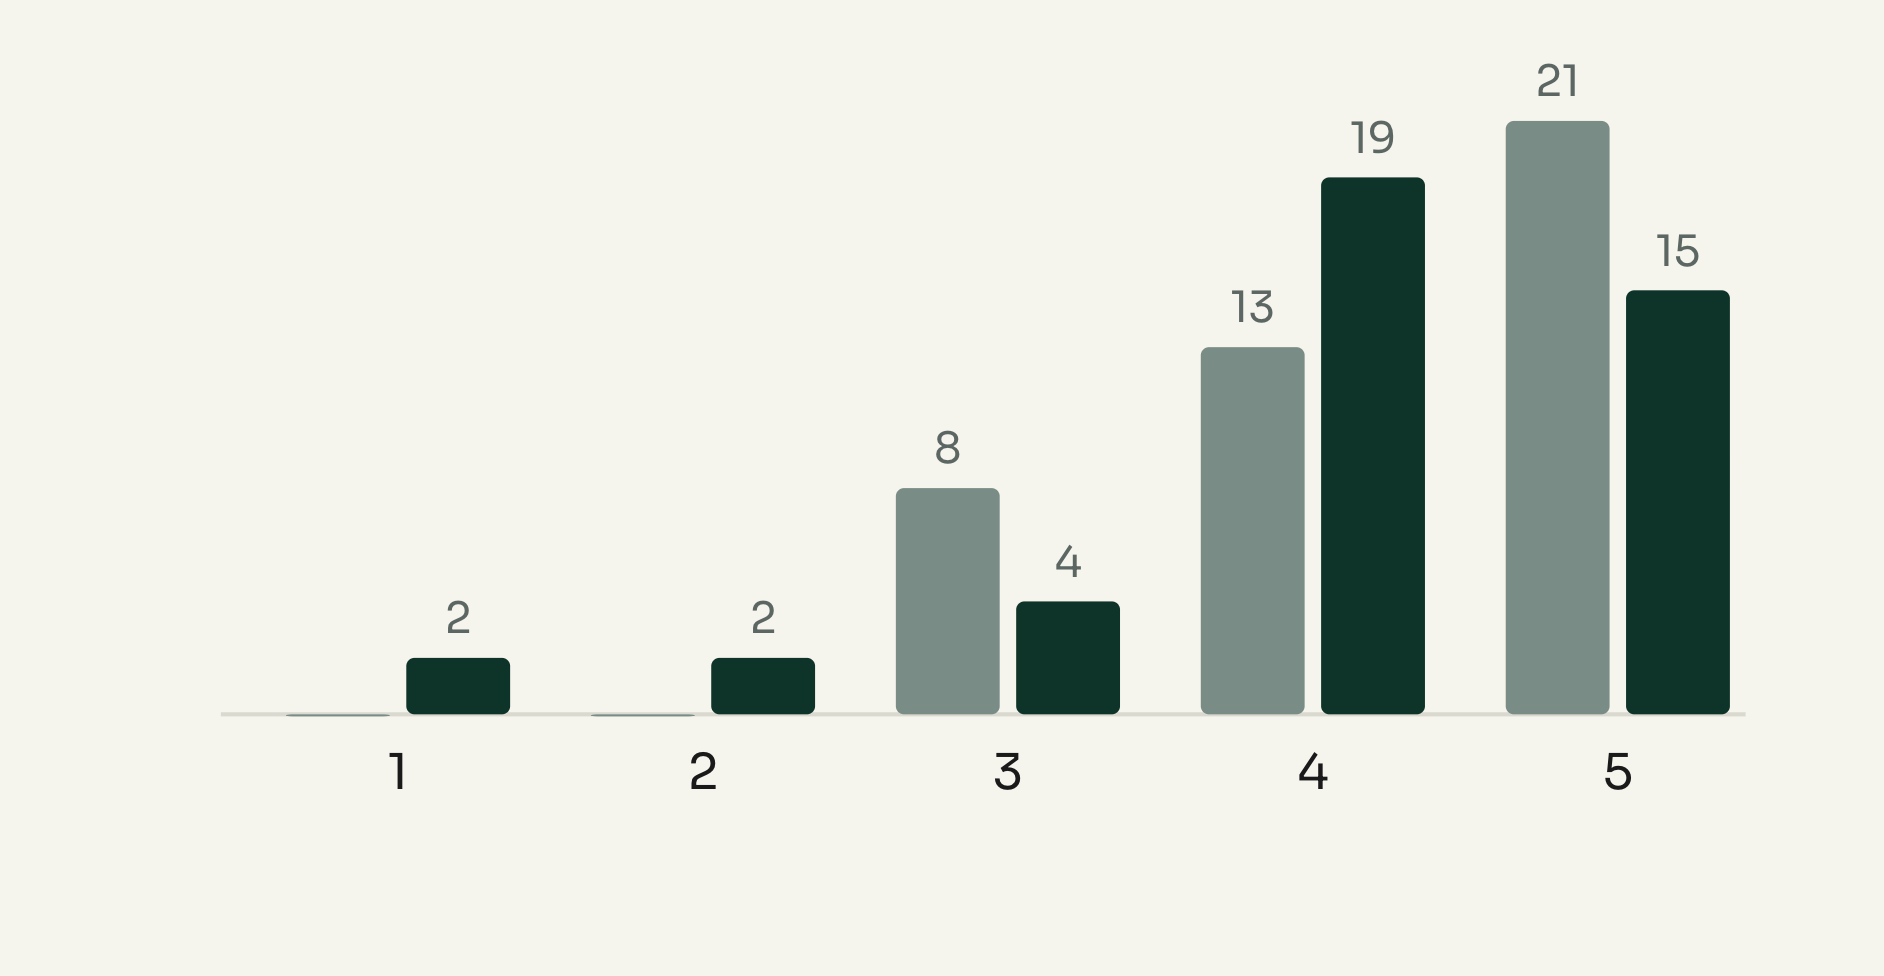 |
Confidence mean slipped from 4.31 to 4.02. The two new 1-scores are people who answered "I don't use AI to generate code", so the underlying dip among code-writers is smaller than it looks, but it is not an increase.
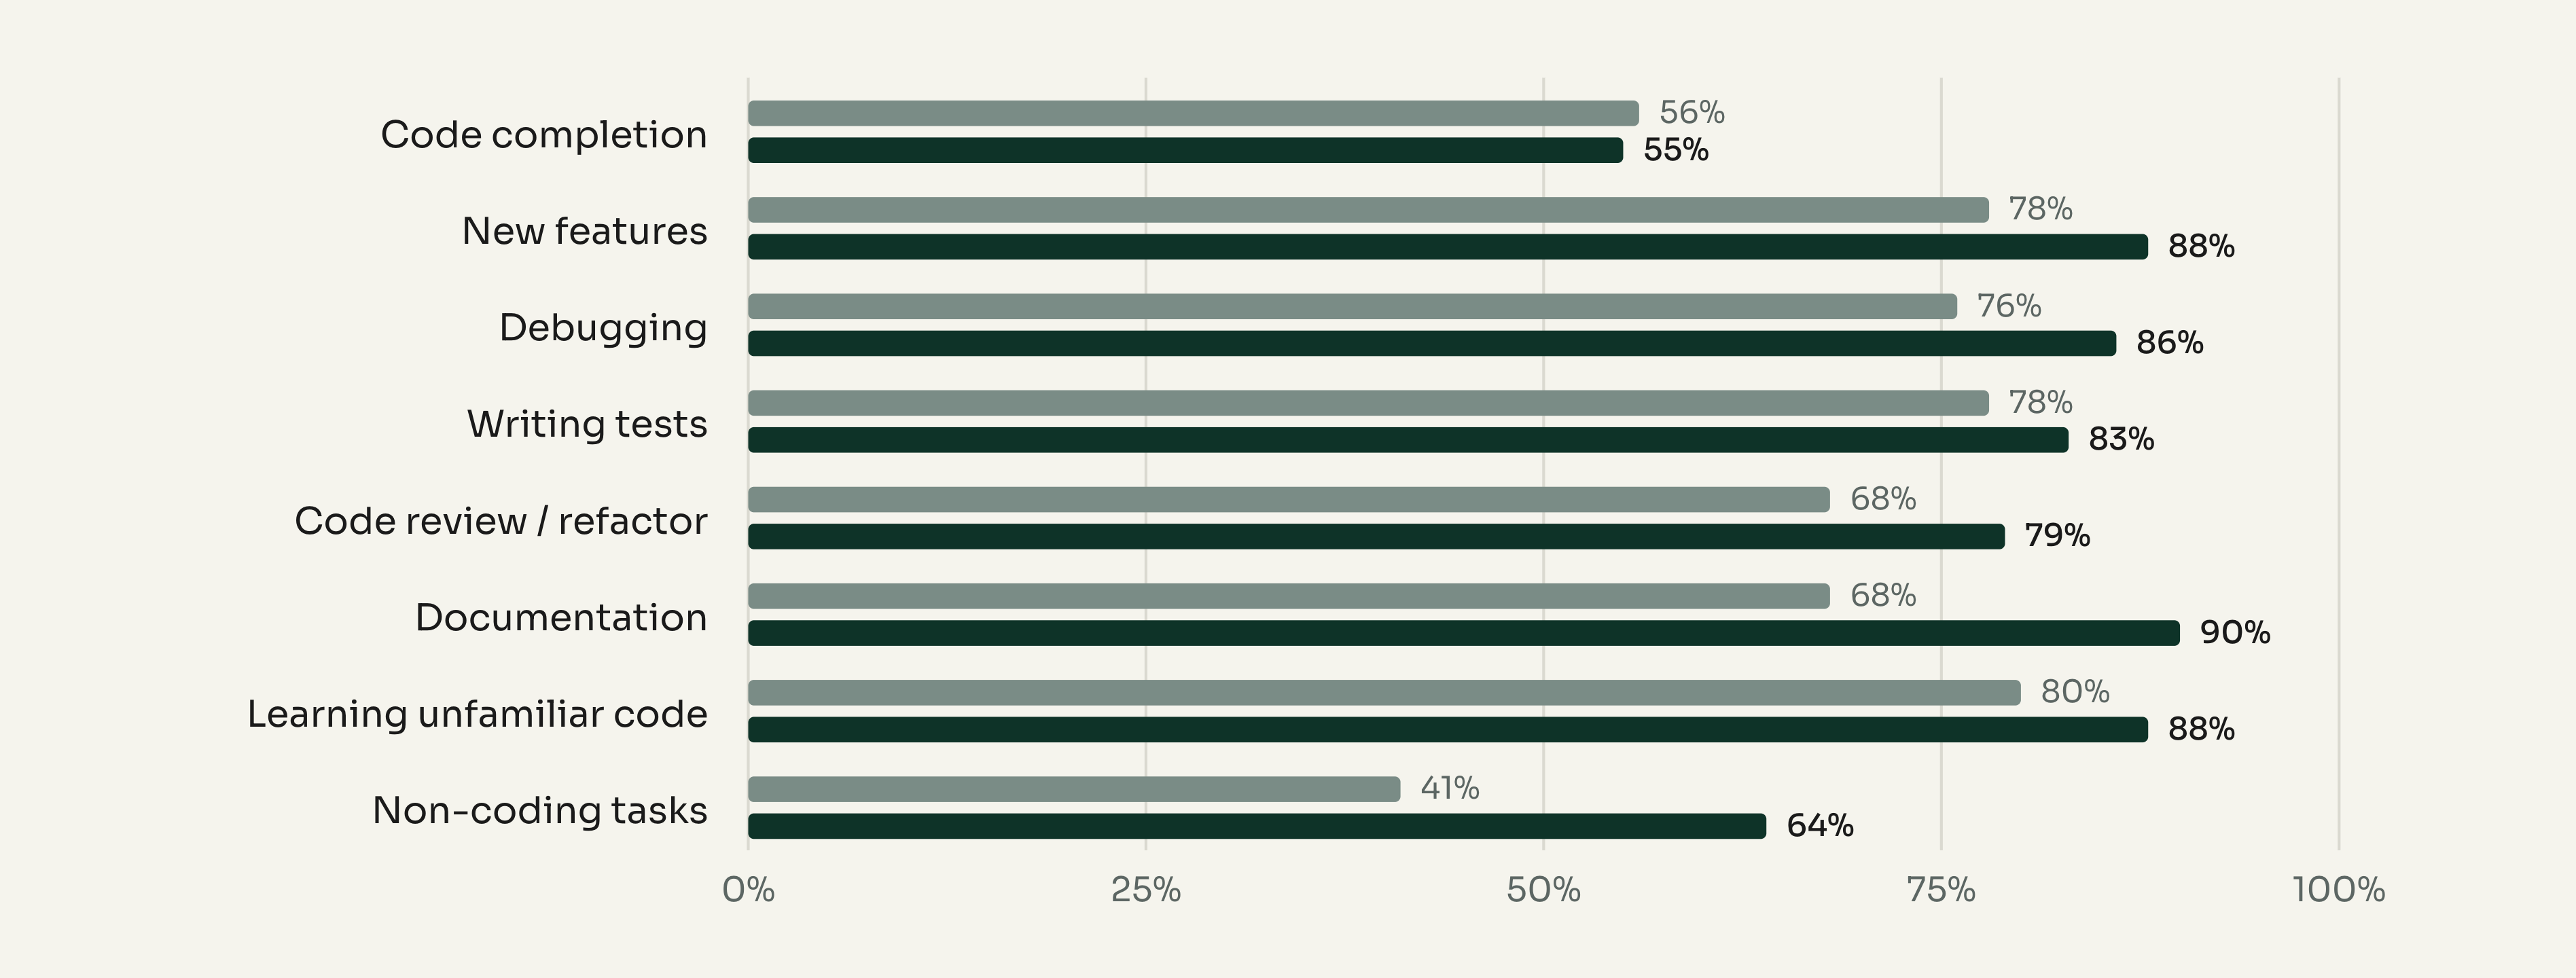
04 — Where the growth actually happened.
The eight-task matrix is the most granular behavioural data in the survey and it contains the sharpest finding: code completion is the only task that did not grow. Autocomplete is flat at roughly half the team while every generative and comprehension task climbed. The team is not using AI to type faster, it is using it to produce and understand whole units of work.
Use this regularly or every possible time
Use this every possible time (the intensity measure)
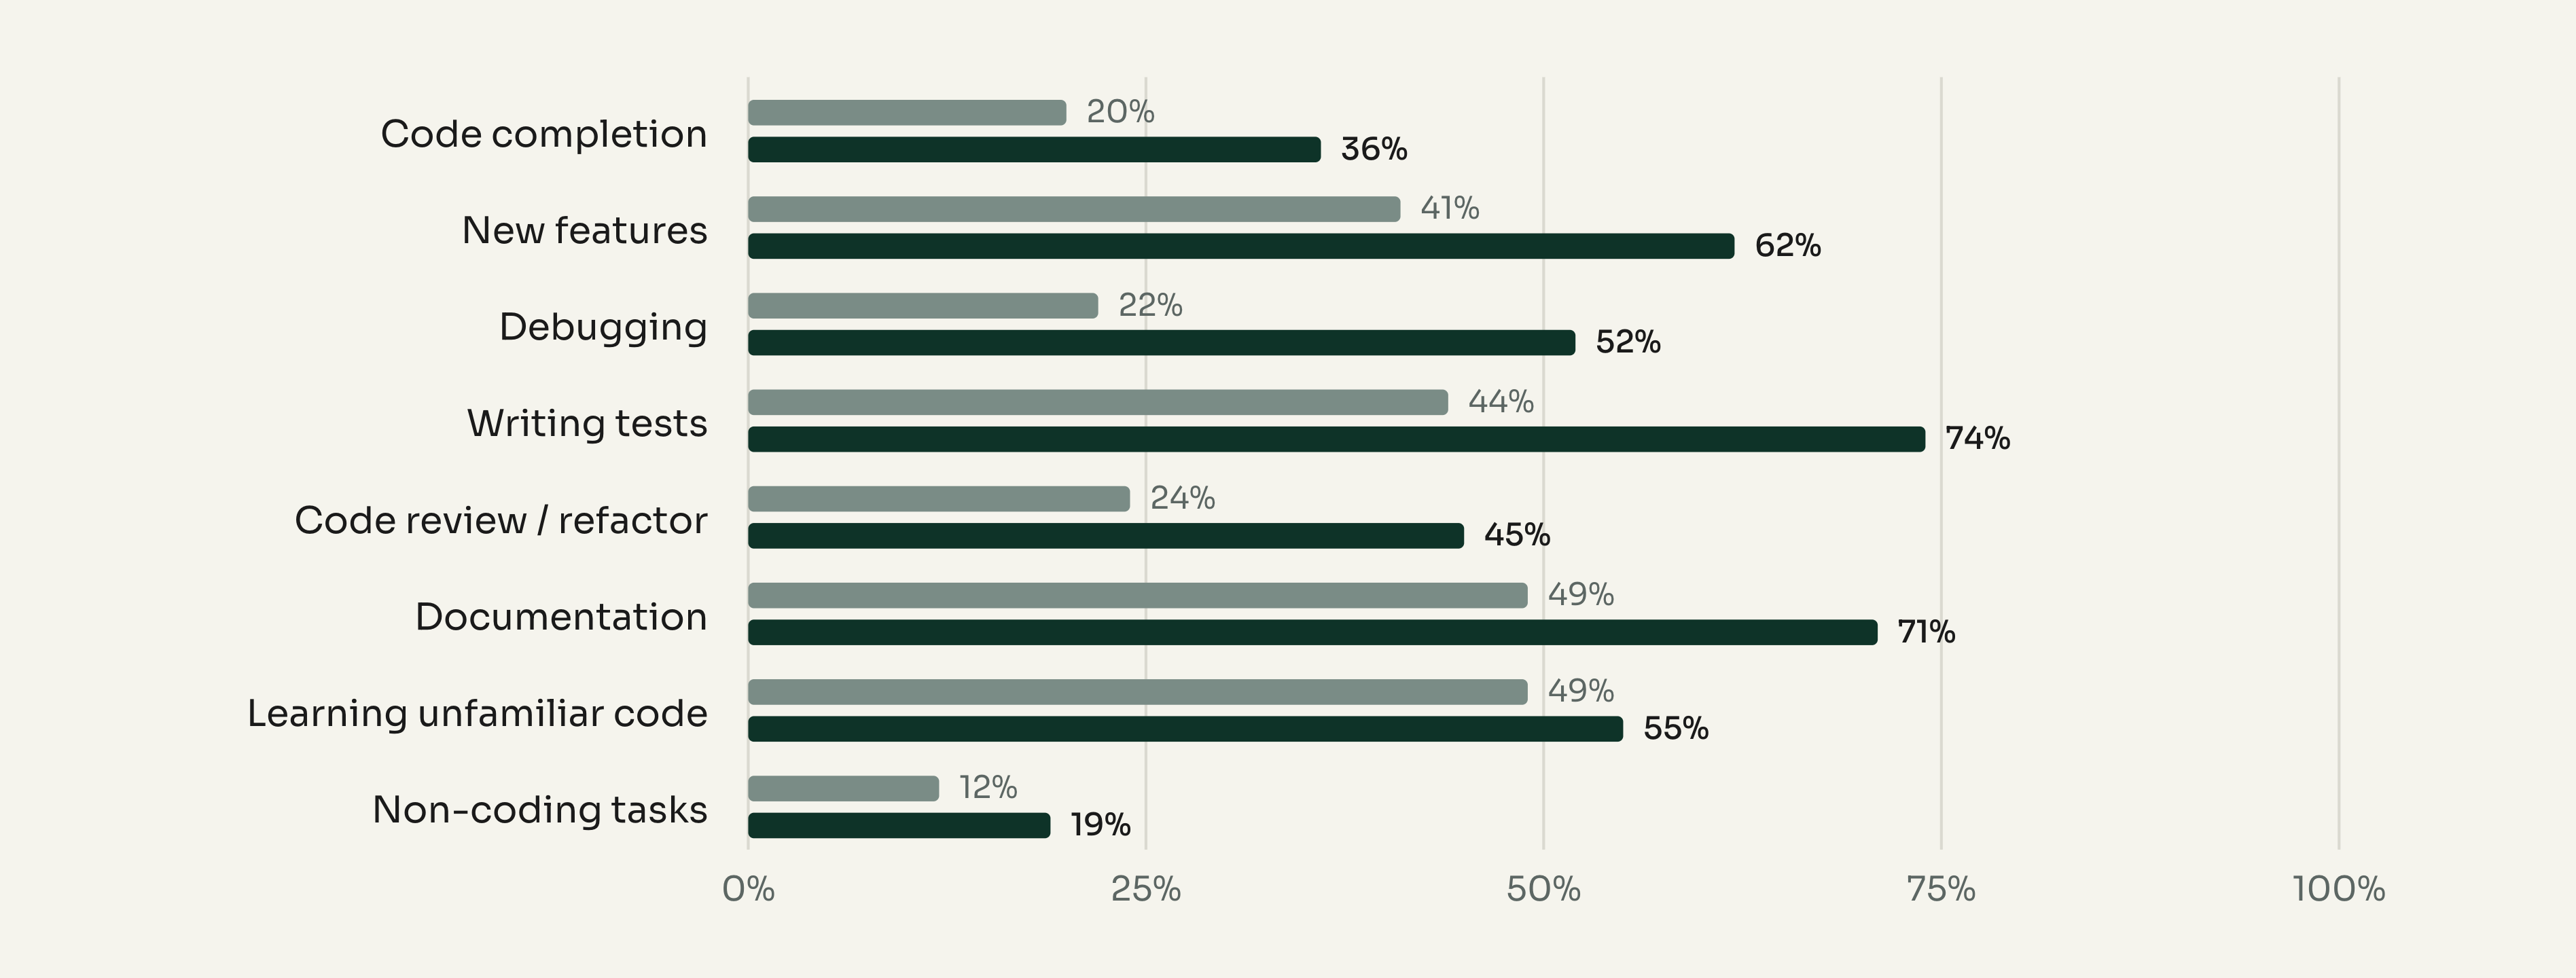
The intensity view is the more dramatic one. "Every possible time" for writing tests went 44% to 74%, documentation 49% to 71%, new features 41% to 62%. Documentation is now the single most AI-delegated activity in the company, which is worth holding next to the slop concern in section 08.
05 — Agentic features went mainstream.
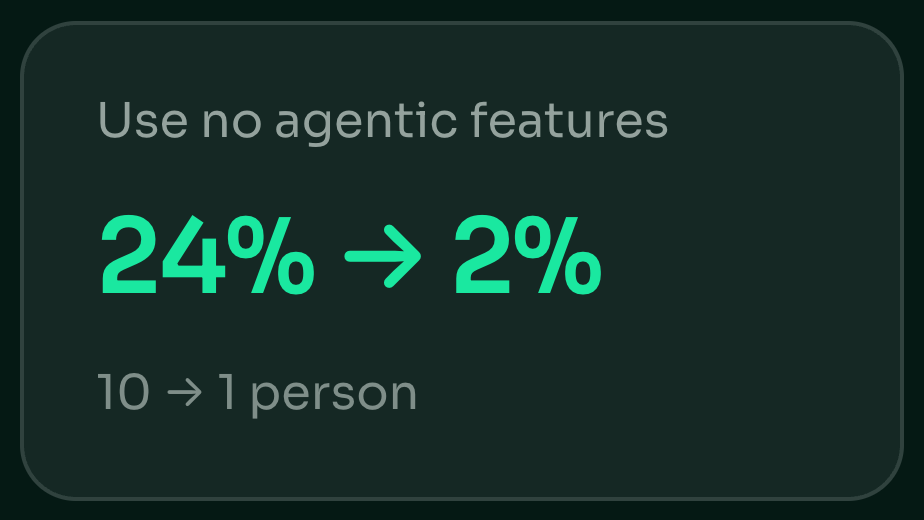
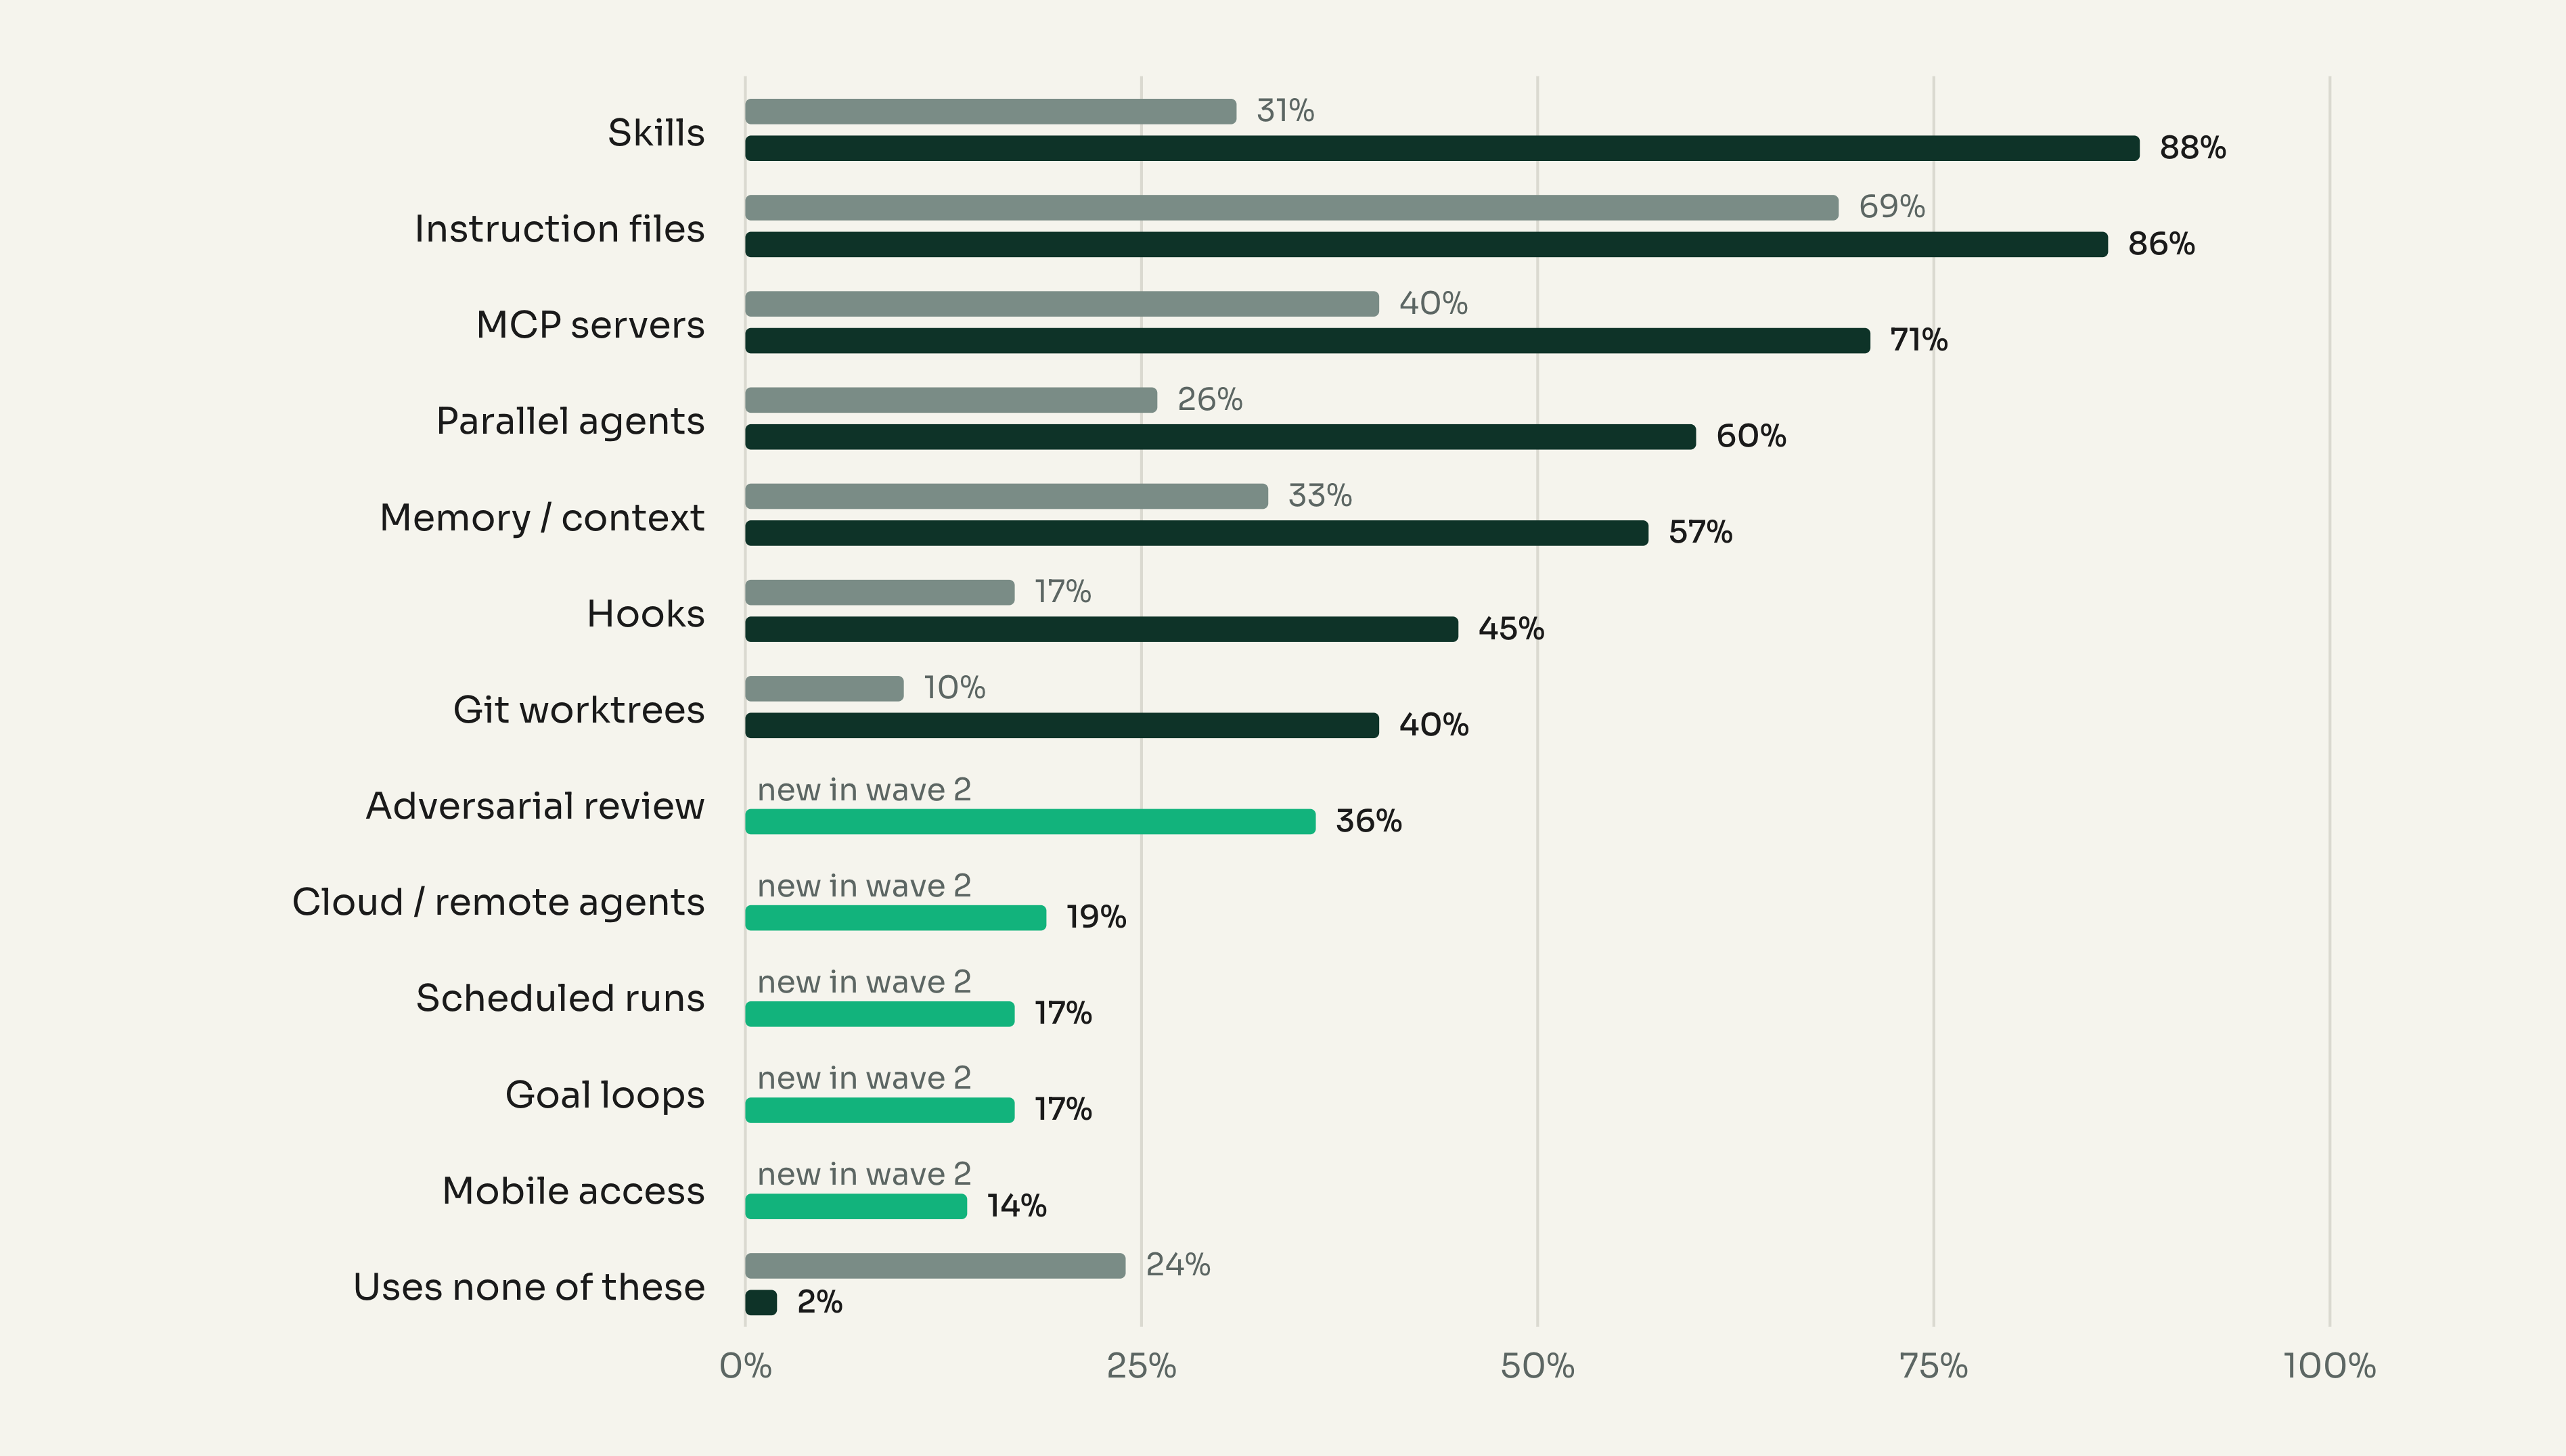
Skills went from a niche 31% to the most-used feature at 88%. Every capability in the original list grew, and the five capabilities added in wave 2 arrived already in double digits. Only one person now reports using no agentic features at all, down from ten.
06 — Tooling consolidated onto one vendor.
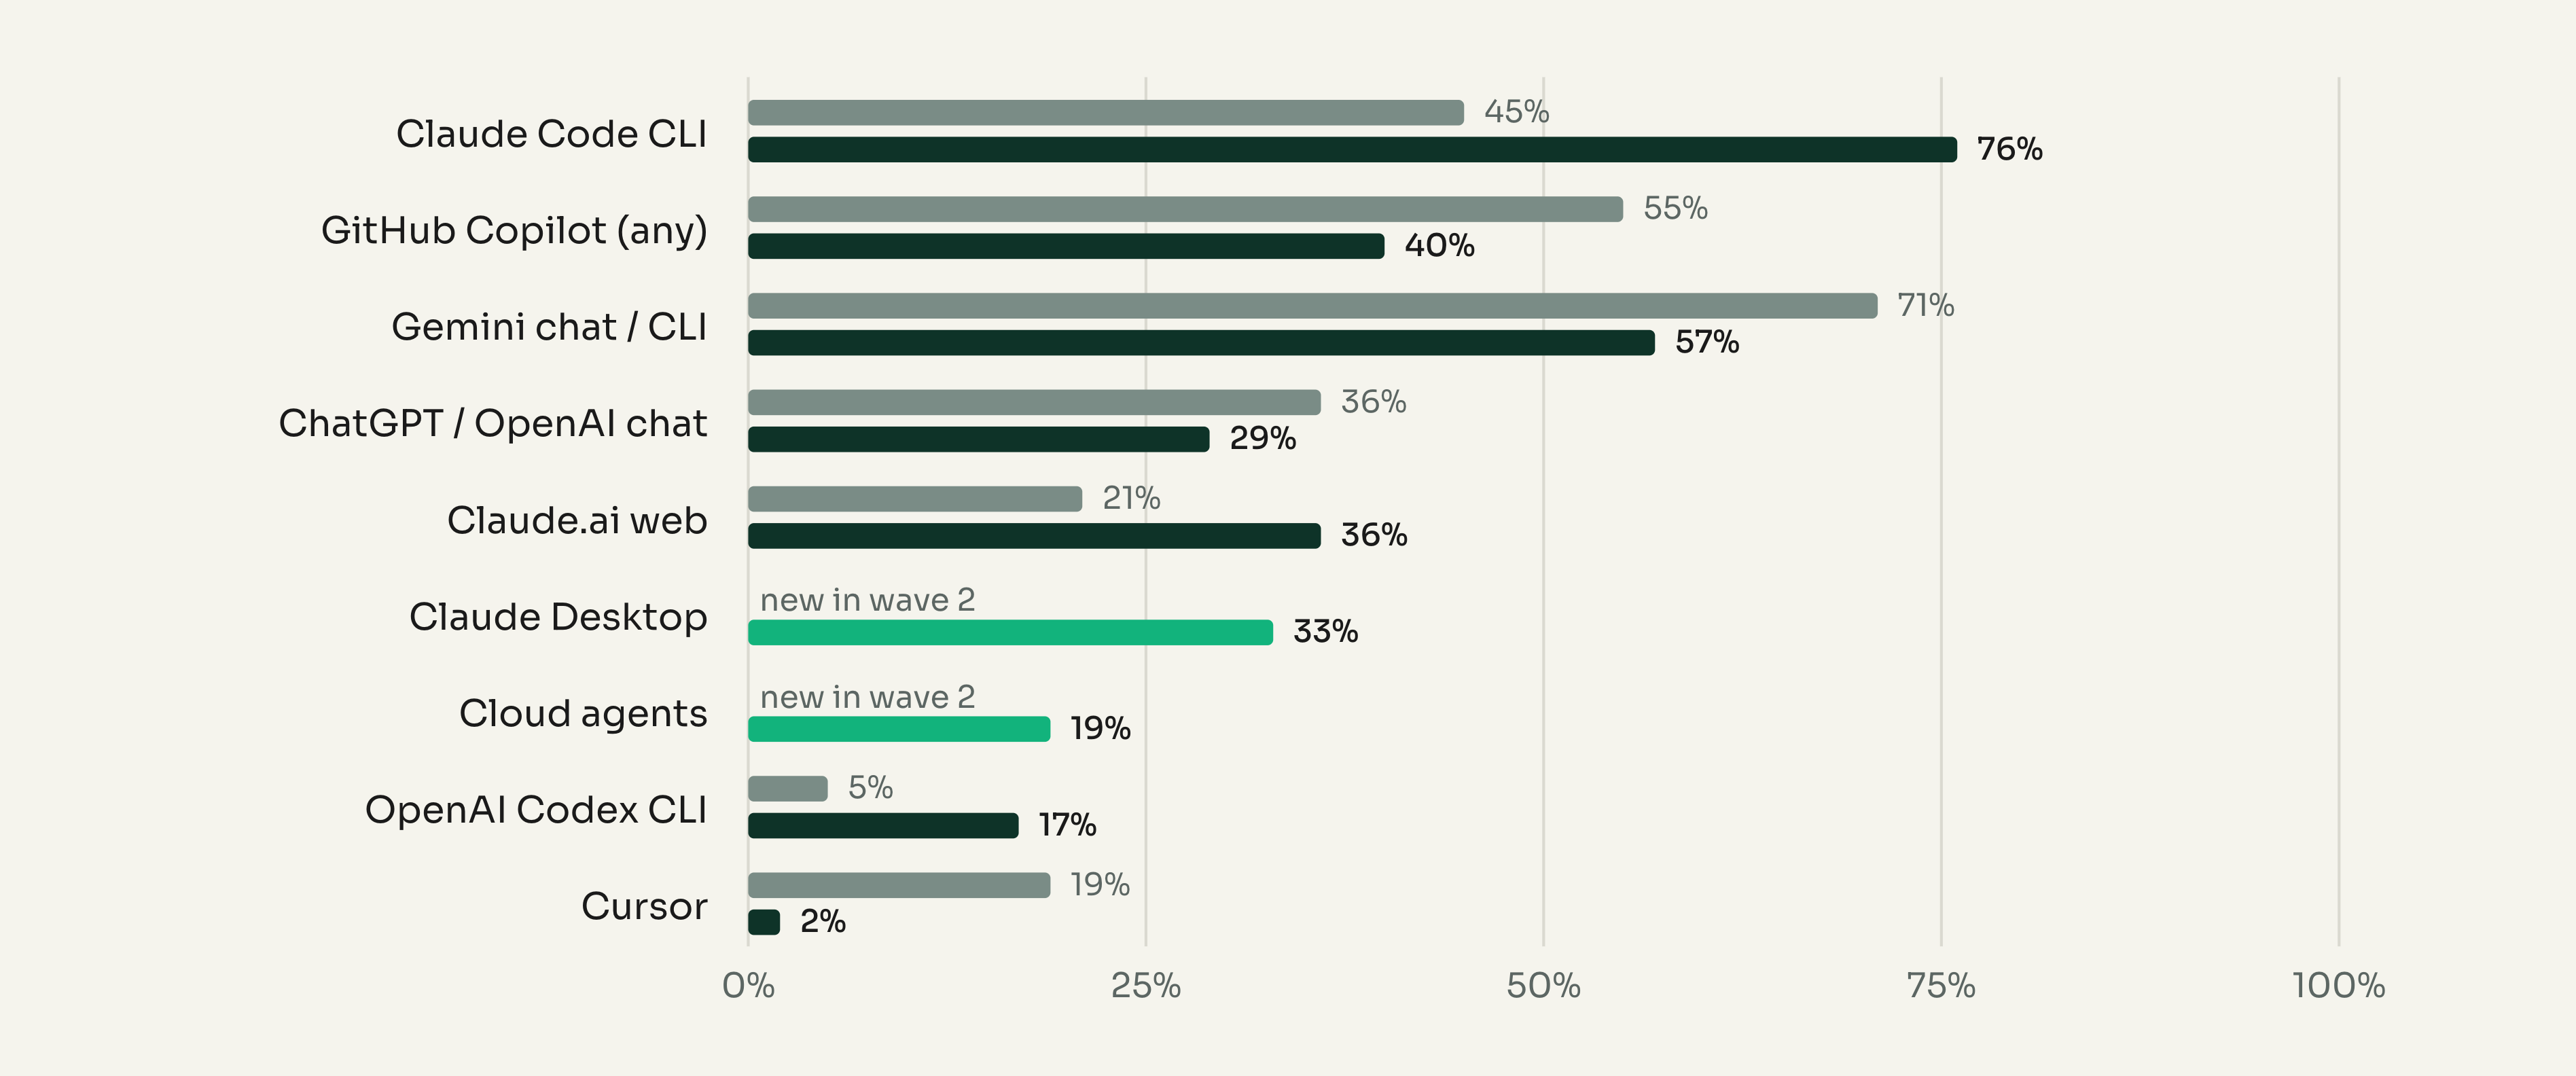
Claude Code CLI overtook GitHub Copilot and roughly doubled. Copilot fell. Cursor collapsed from eight users to one. Anthropic models are now named by every single respondent, up from 86%.
Tools actively used
Model providers used
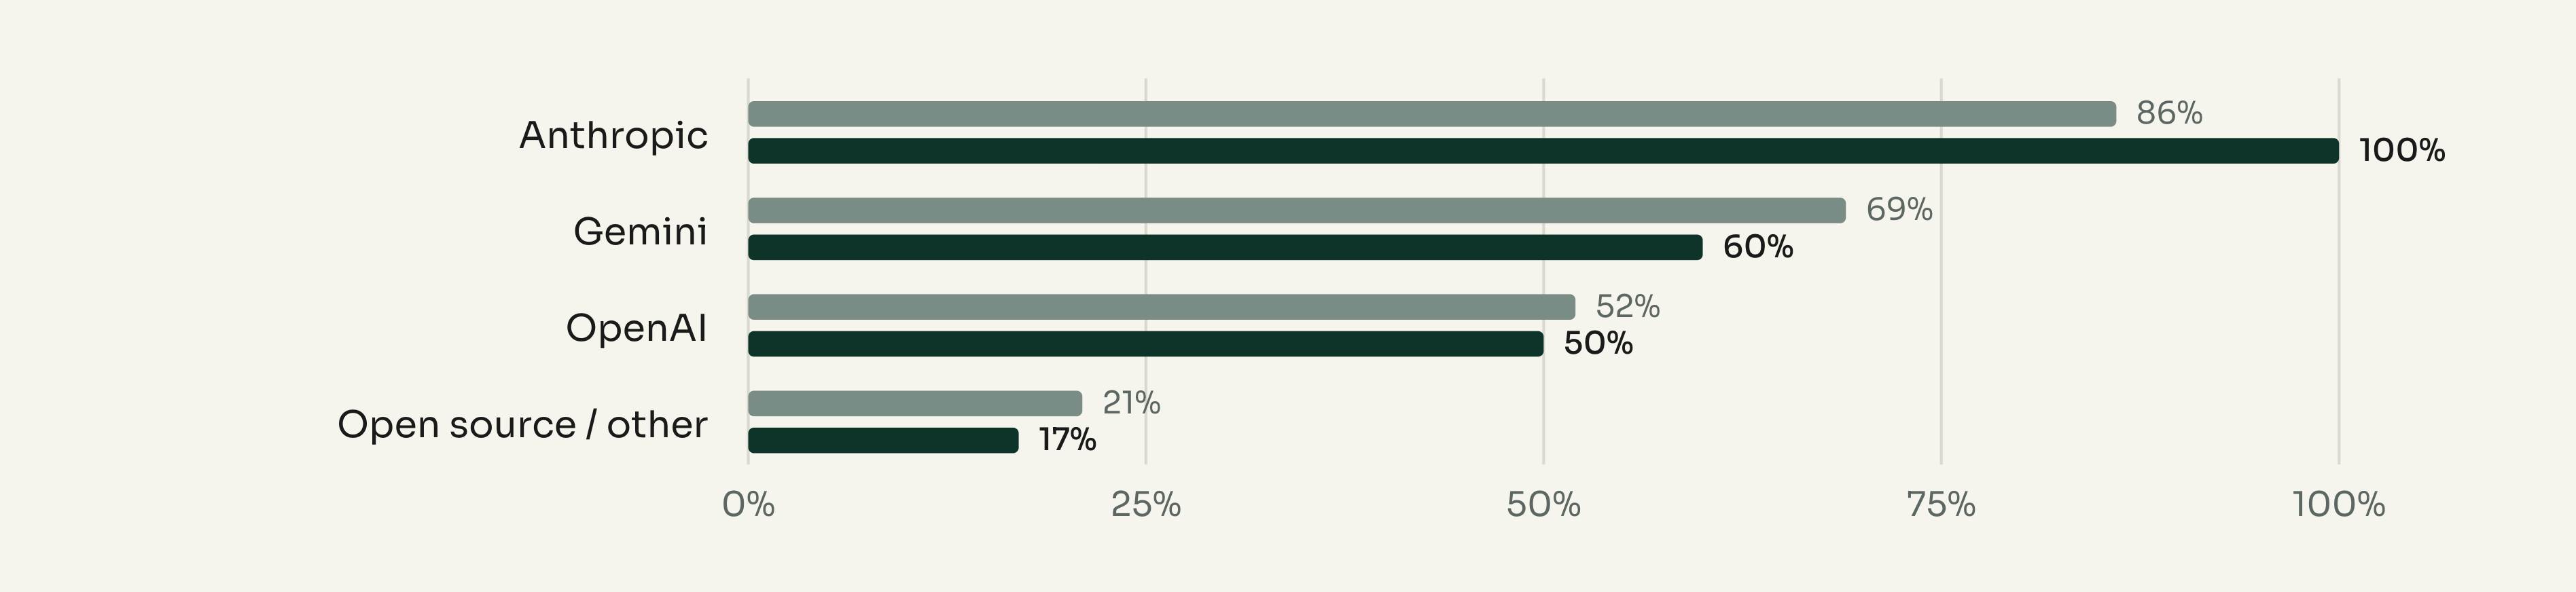
Read this next to section 10. Consolidation onto a single paid vendor is happening at the same moment that cost and quota complaints appear as a new unprompted theme. That is a procurement conversation, not an enablement one.
07 — Governance improved. Review rigour did not.
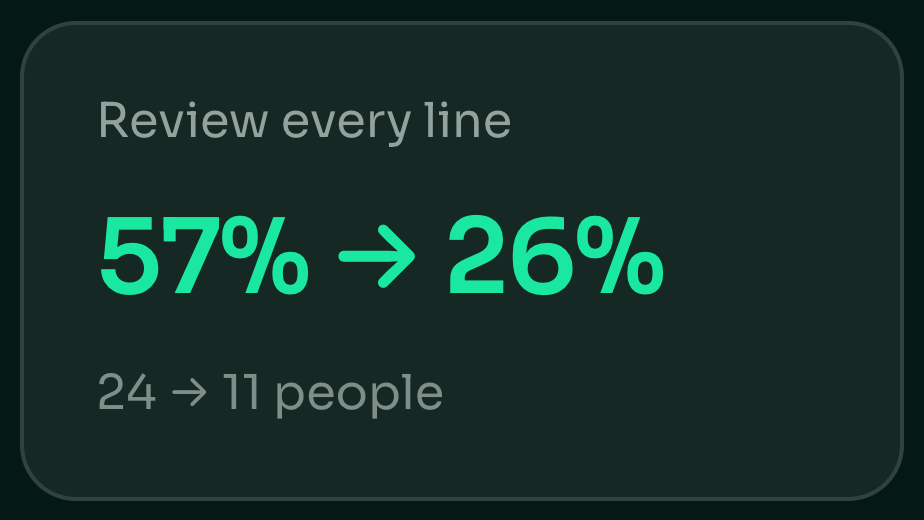
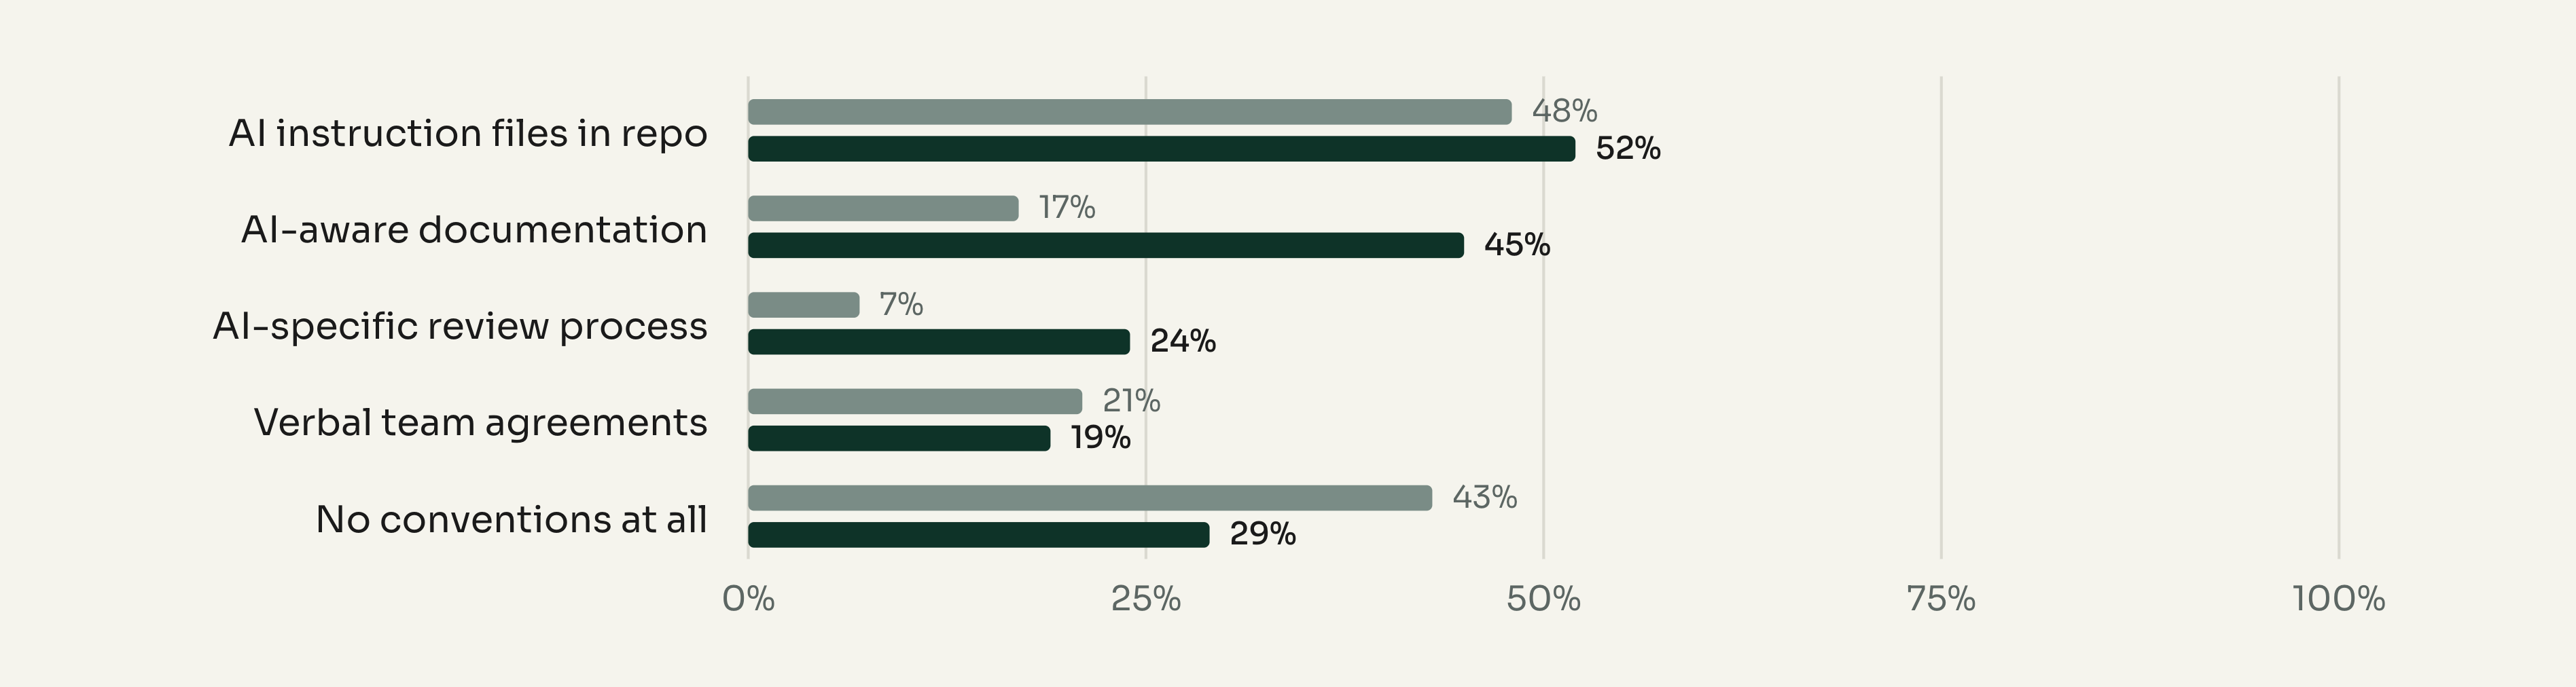
Project conventions genuinely matured: AI-aware documentation nearly tripled, AI-specific review gates more than tripled, and "no conventions at all" fell by a third. But human review thinned out at the same time. Line-by-line review halved, and a pattern that did not exist in March, delegating review to a second AI, now accounts for roughly a quarter of answers.
Conventions specified in projects
How carefully AI code is reviewed
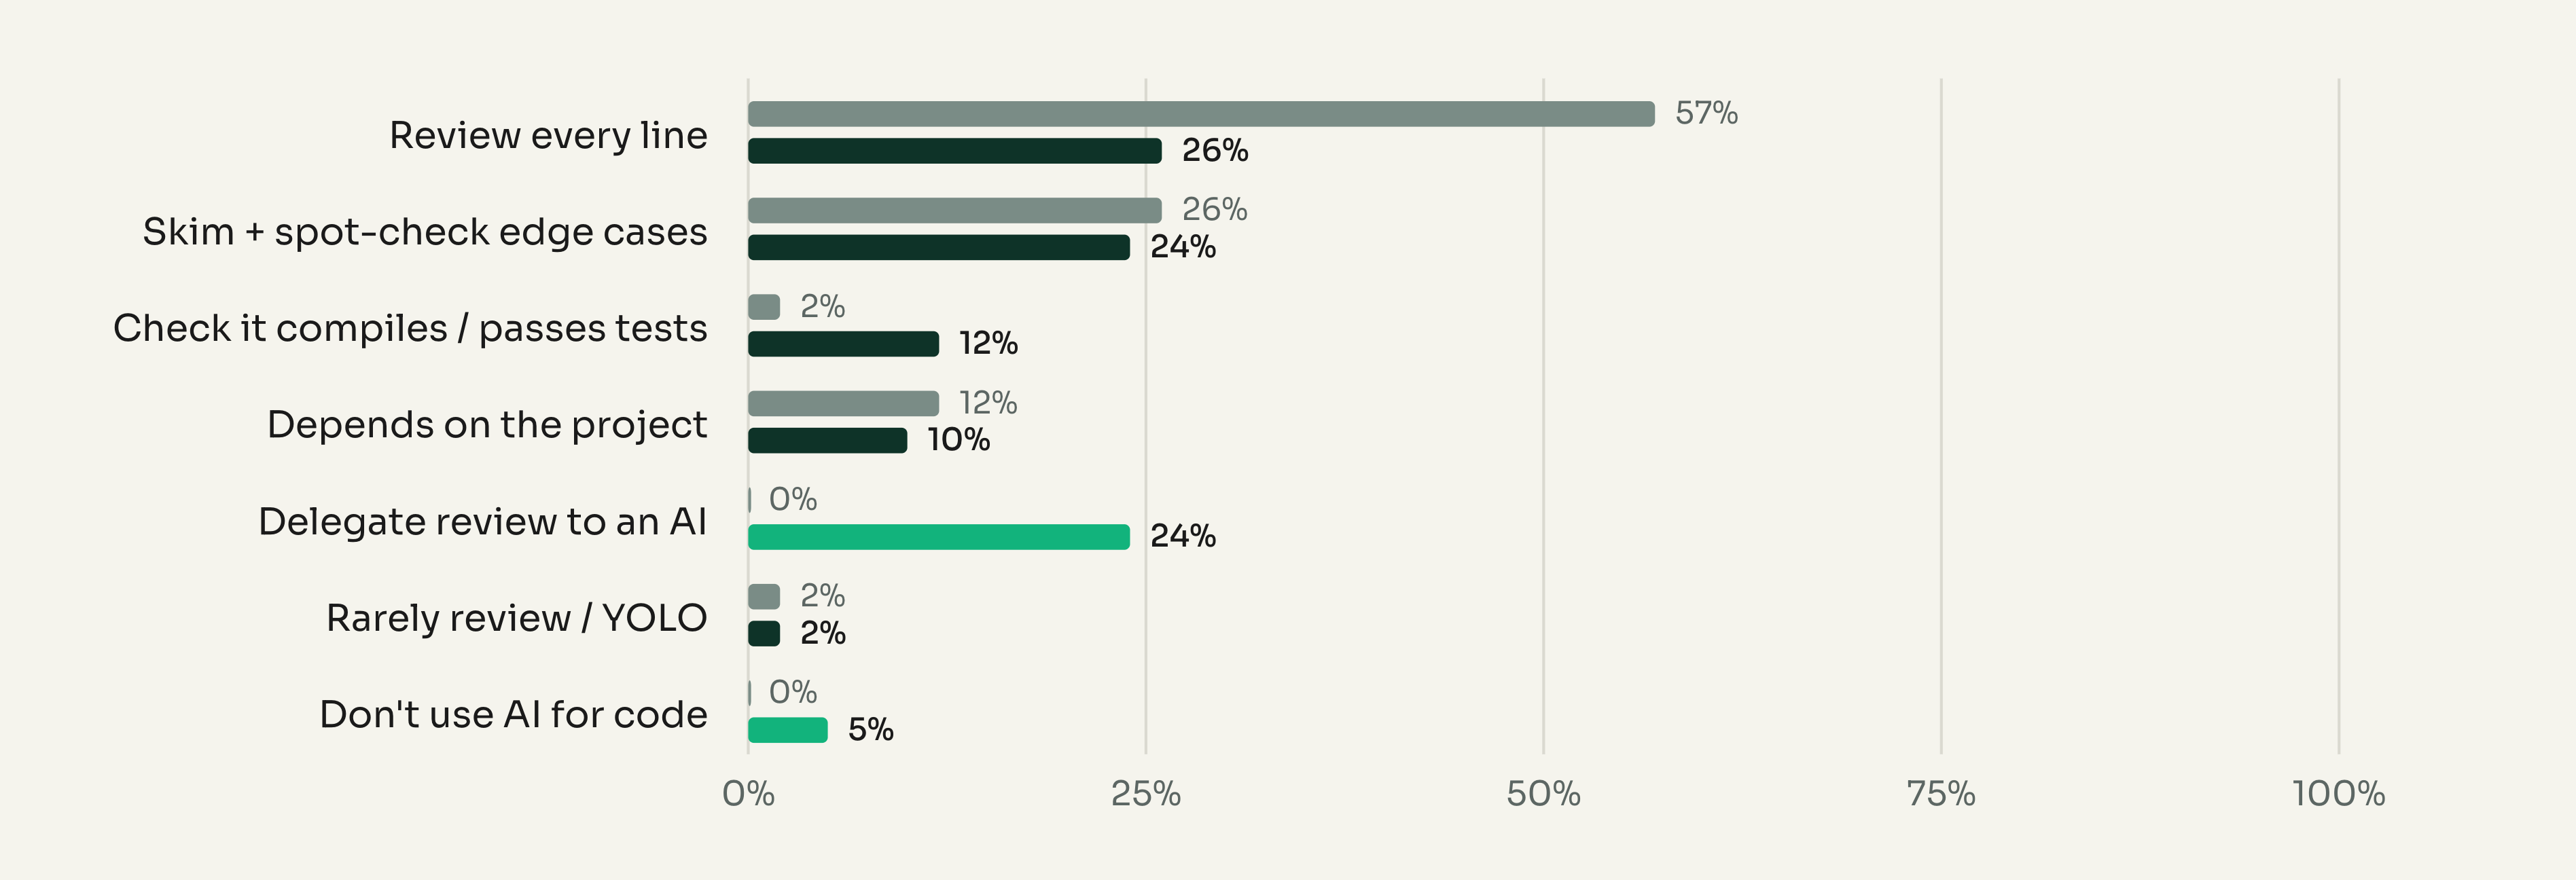
"Delegate review to an AI" is reconstructed from free-text answers in both waves; it was not an offered option in either. Zero people described it in March, ten did in July.
08 — The worry profile inverted.
Security anxiety nearly halved and logic-bug worry fell, which reads like familiarity. But the concerns that track comprehension went the other way. Loss of codebase understanding is now the single most-cited concern, and "too much slop", a brand new option, debuted at nearly half the team.
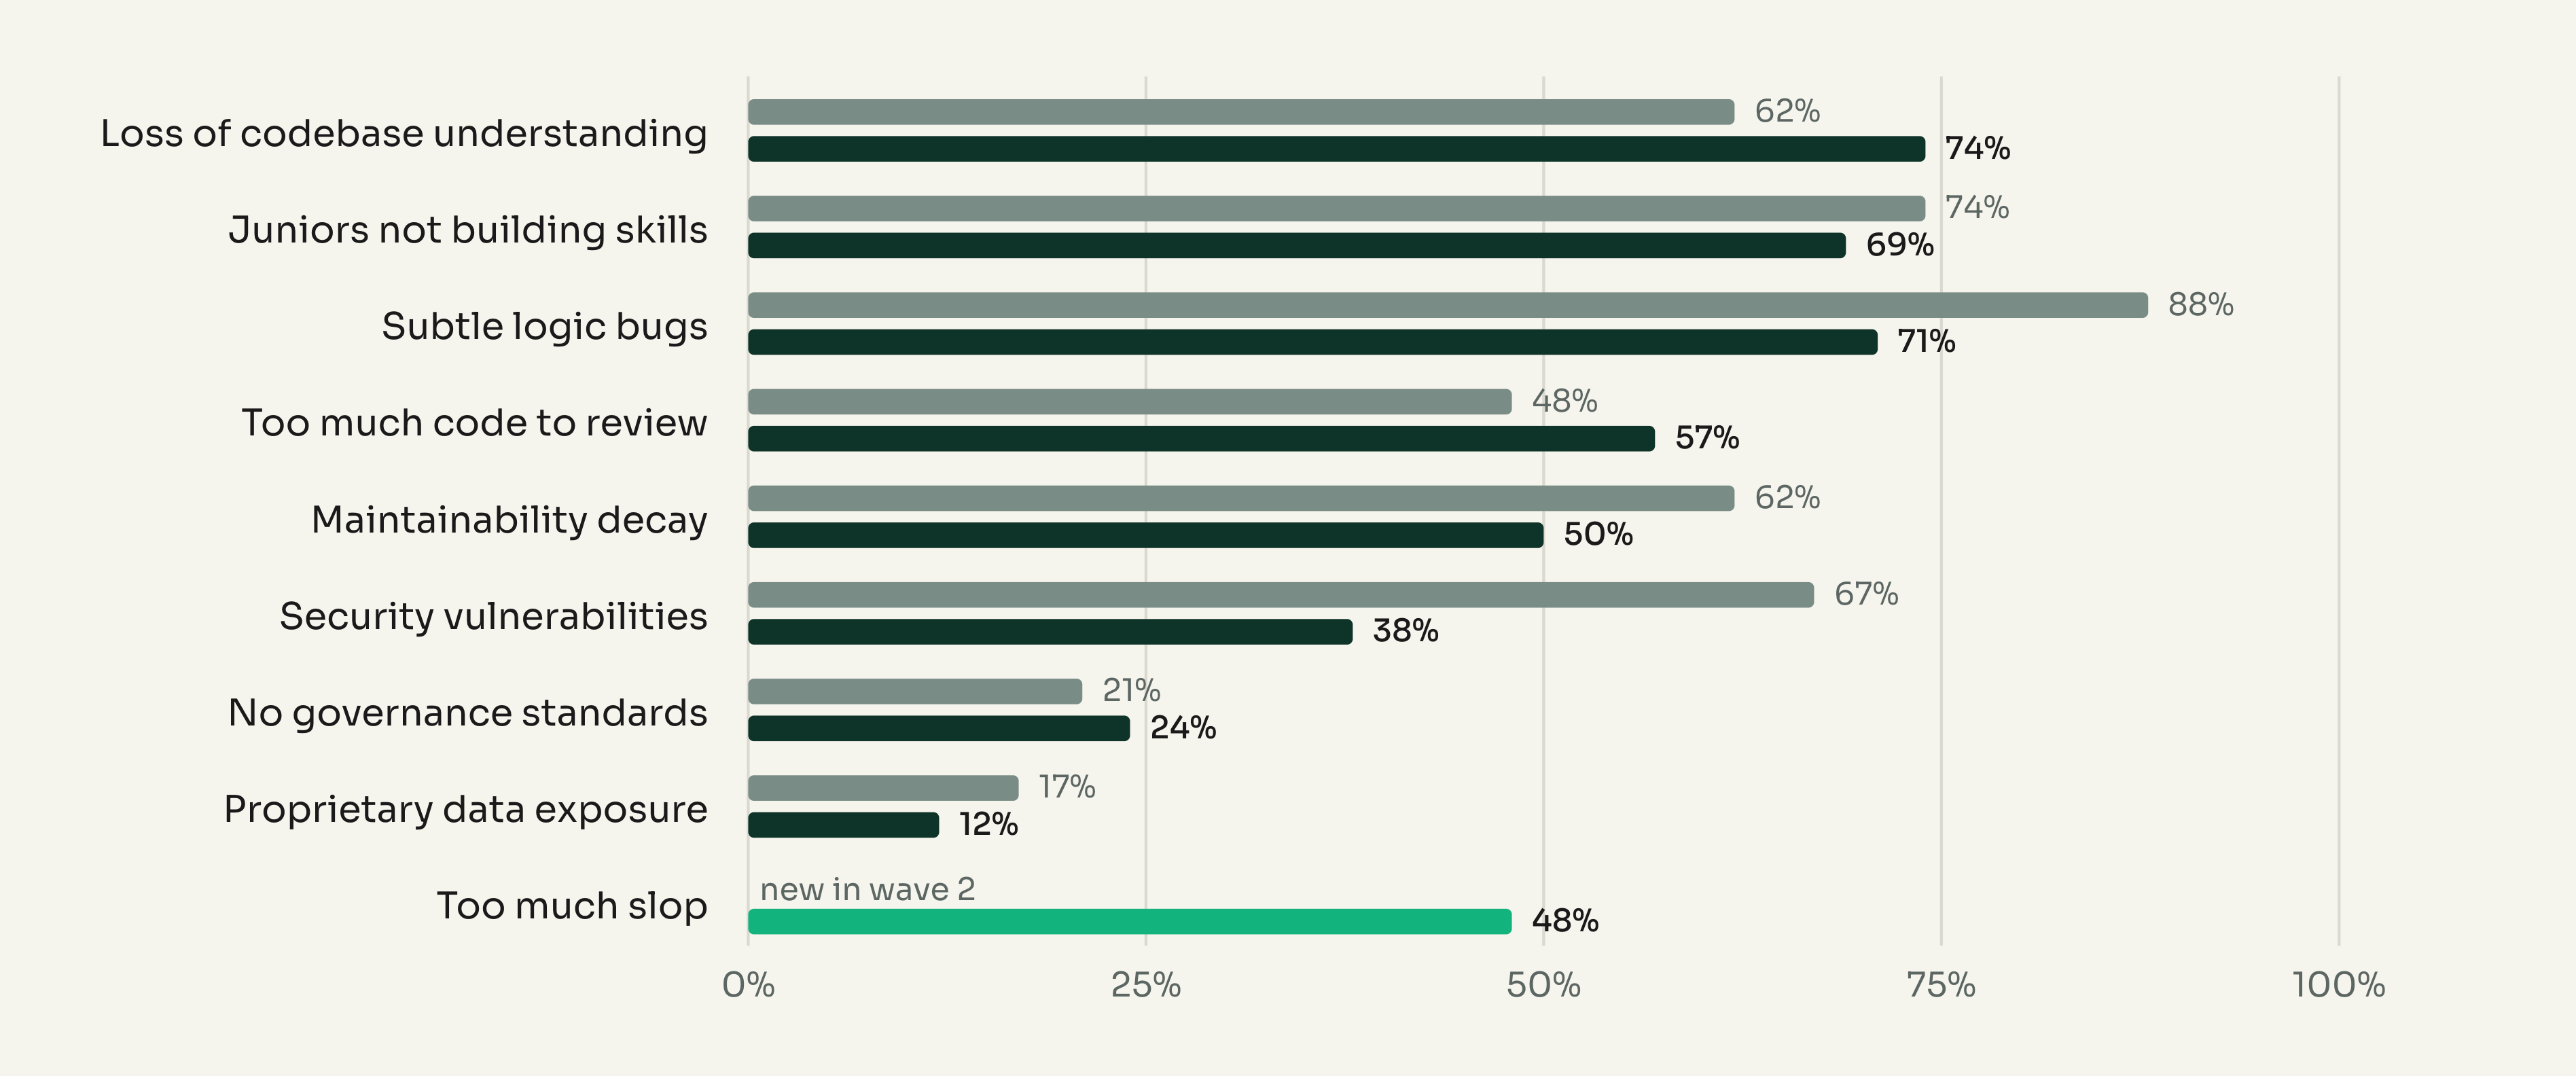
Held together: more code, generated faster, reviewed less carefully, by people increasingly worried they no longer understand the codebase. Every individual movement is defensible. The combination is the risk.
09 — Quality verdict barely moved.
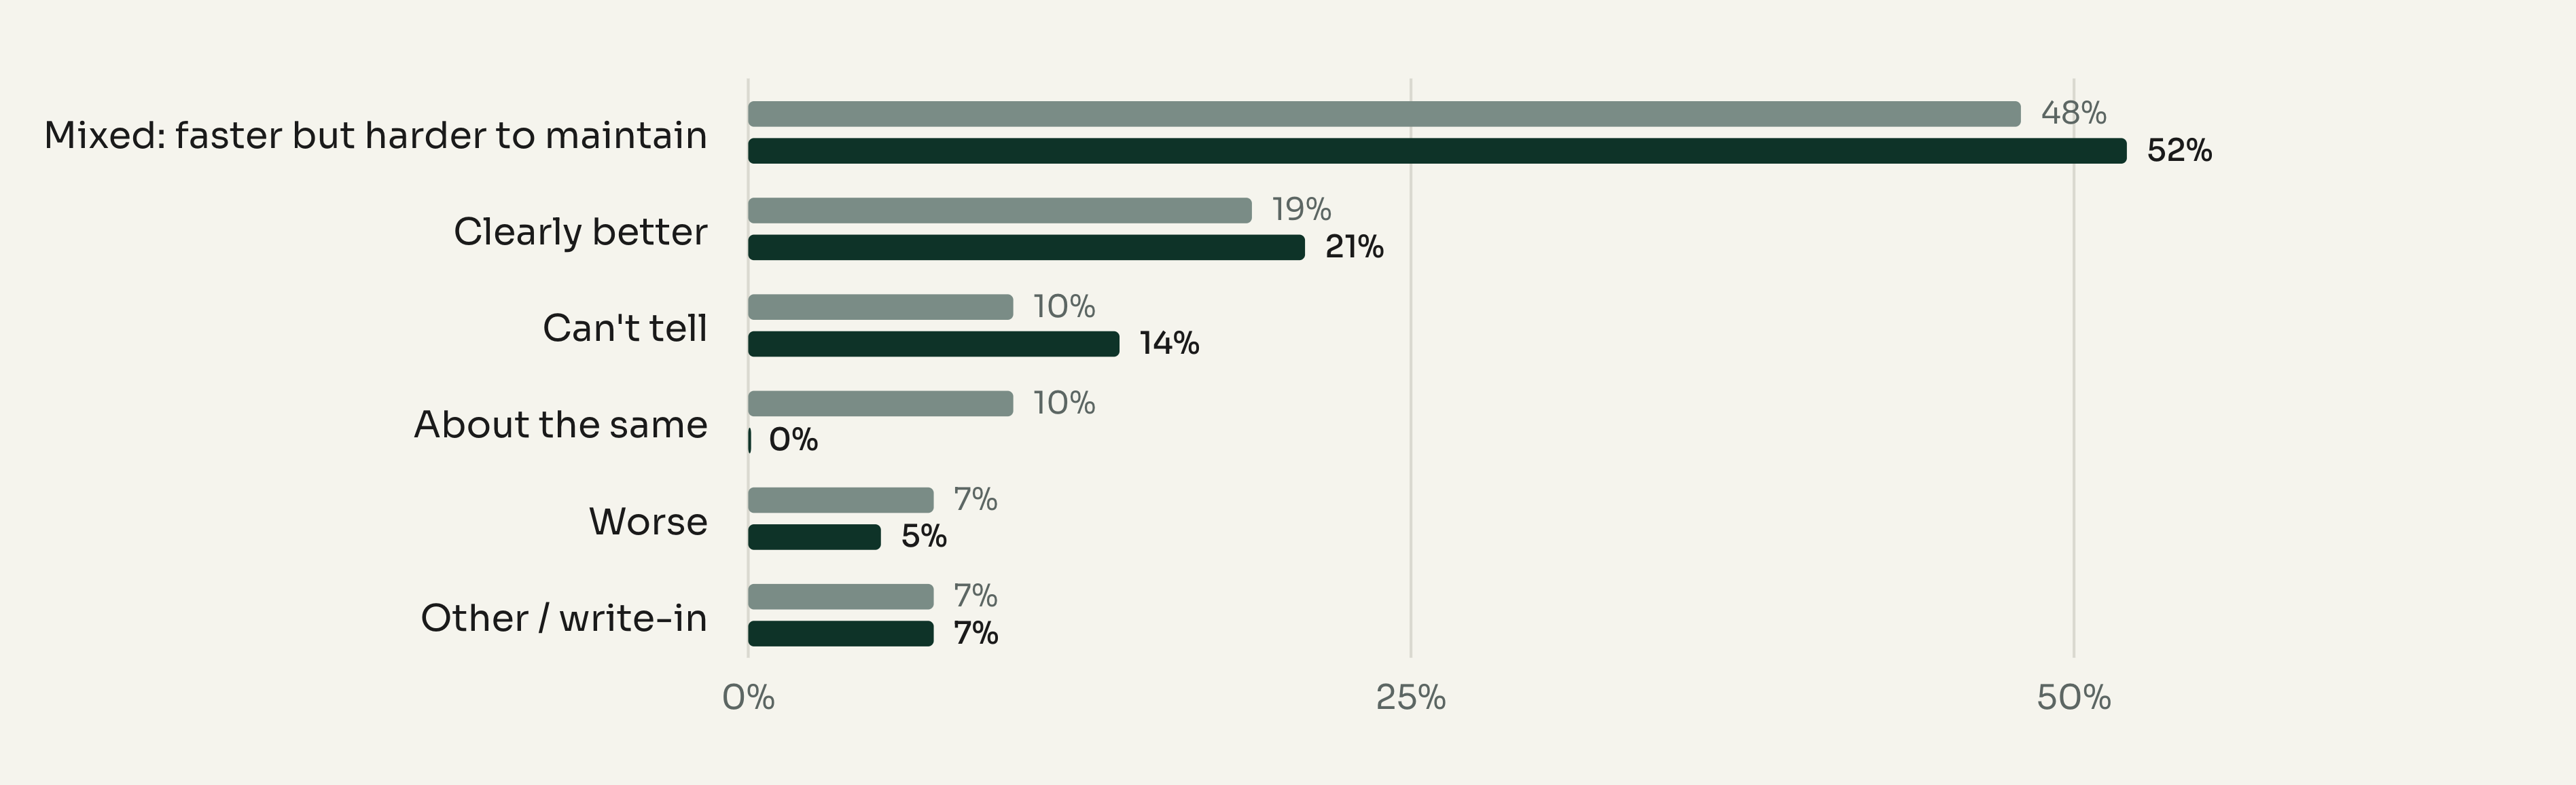
Despite the enormous jump in capability and adoption, the perceived effect on code quality is almost unchanged. "Mixed, faster but harder to maintain" remains the modal answer. "About the same" emptied out entirely, with those people splitting toward both poles.
Overall quality impact of AI on code seen
"Everyone should increase AI usage" (1–5)
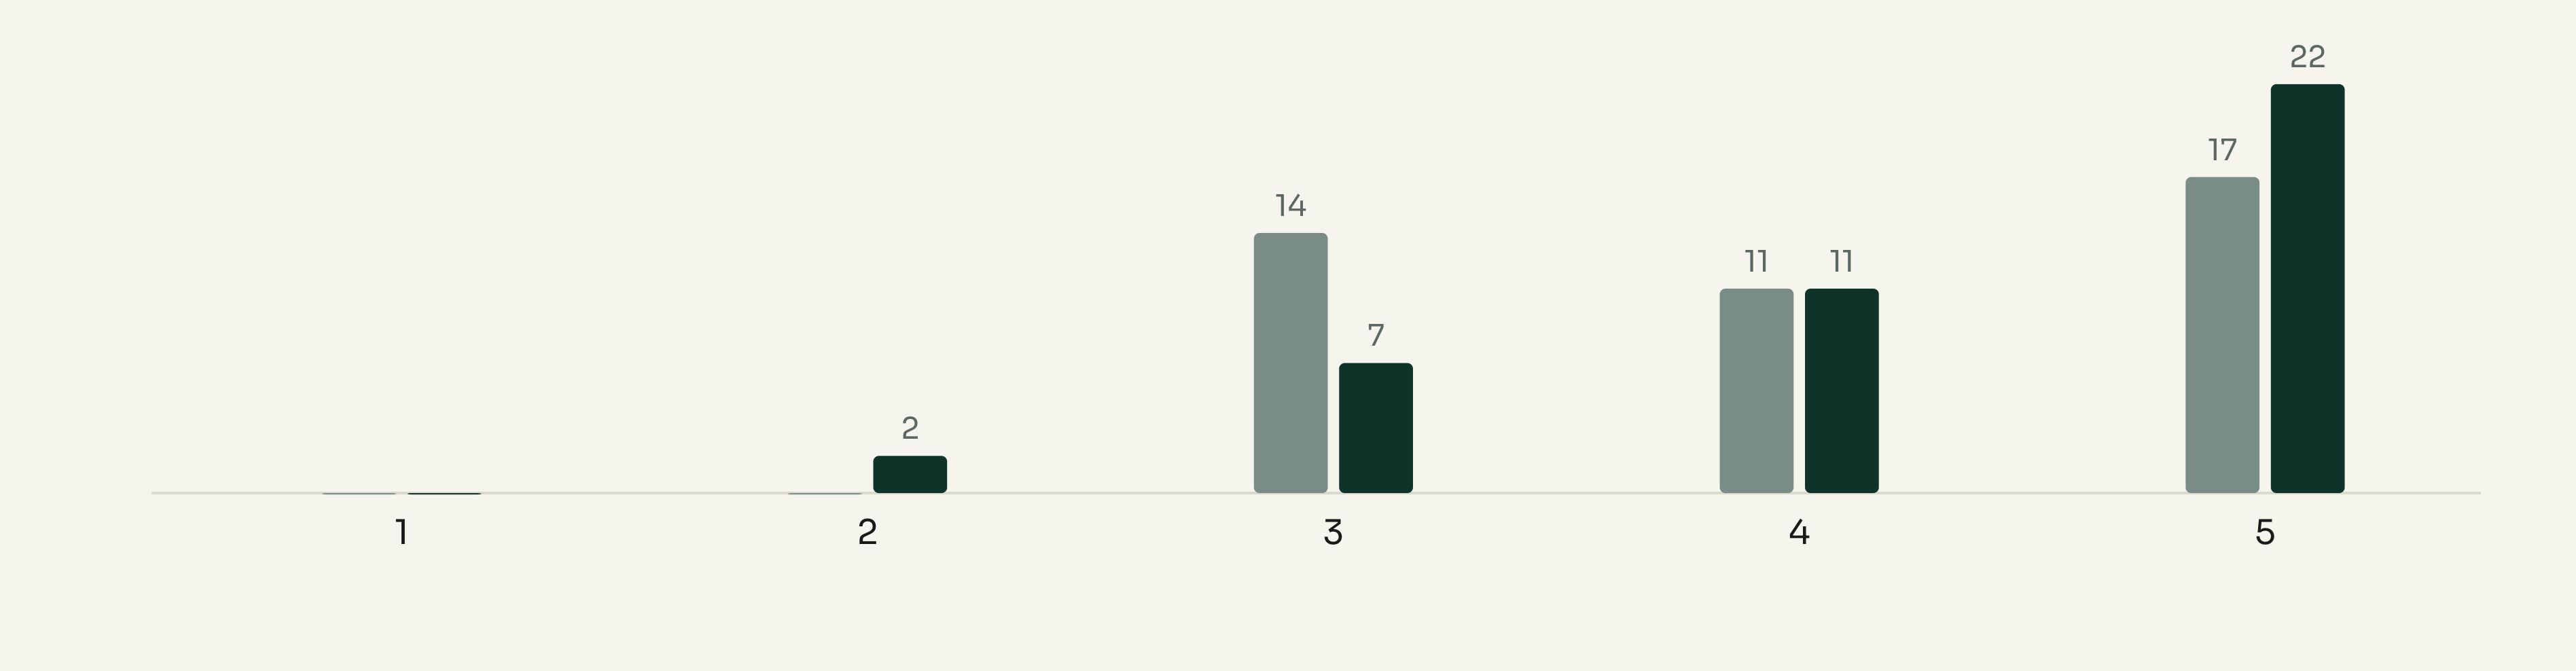
Appetite for the mandate rose slightly, from 4.07 to 4.26. One architect objected to the framing itself: "Where to increase your usage, if you already use AI wherever possible?"
10 — The bottleneck moved from skills to contracts.
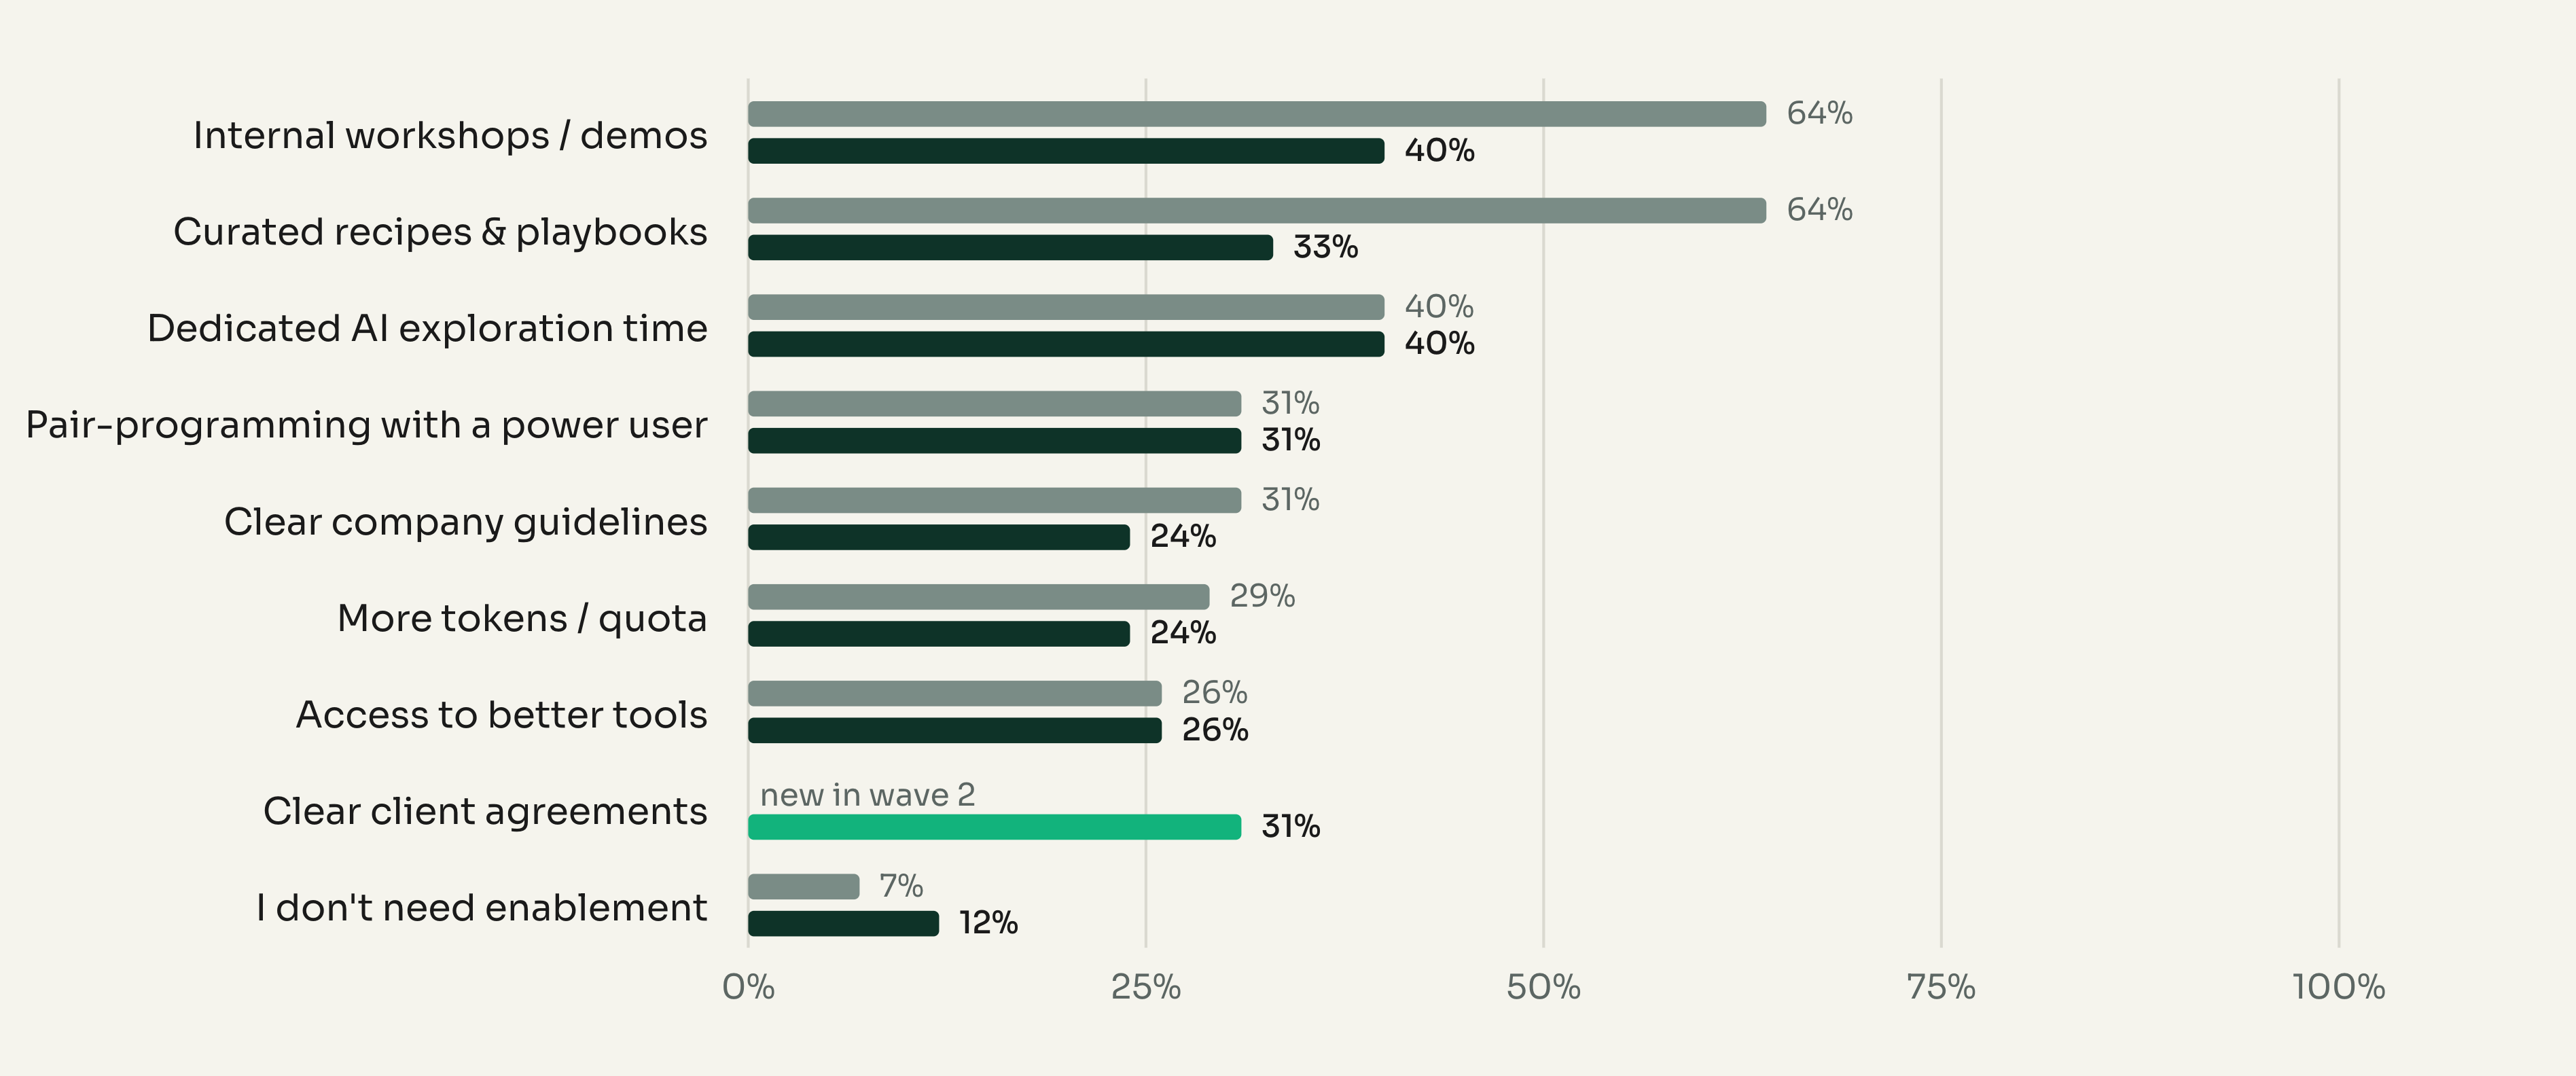
This is the most actionable shift in the dataset. Demand for workshops and recipes, the top two asks in March, collapsed. What replaced them is commercial: clear agreements with clients debuts as the joint third-highest ask, unclear client acceptance appears as a new barrier, and cost or quota limits surface as an unprompted write-in from five people.
What enablement would help most
Biggest barrier to using AI more effectively
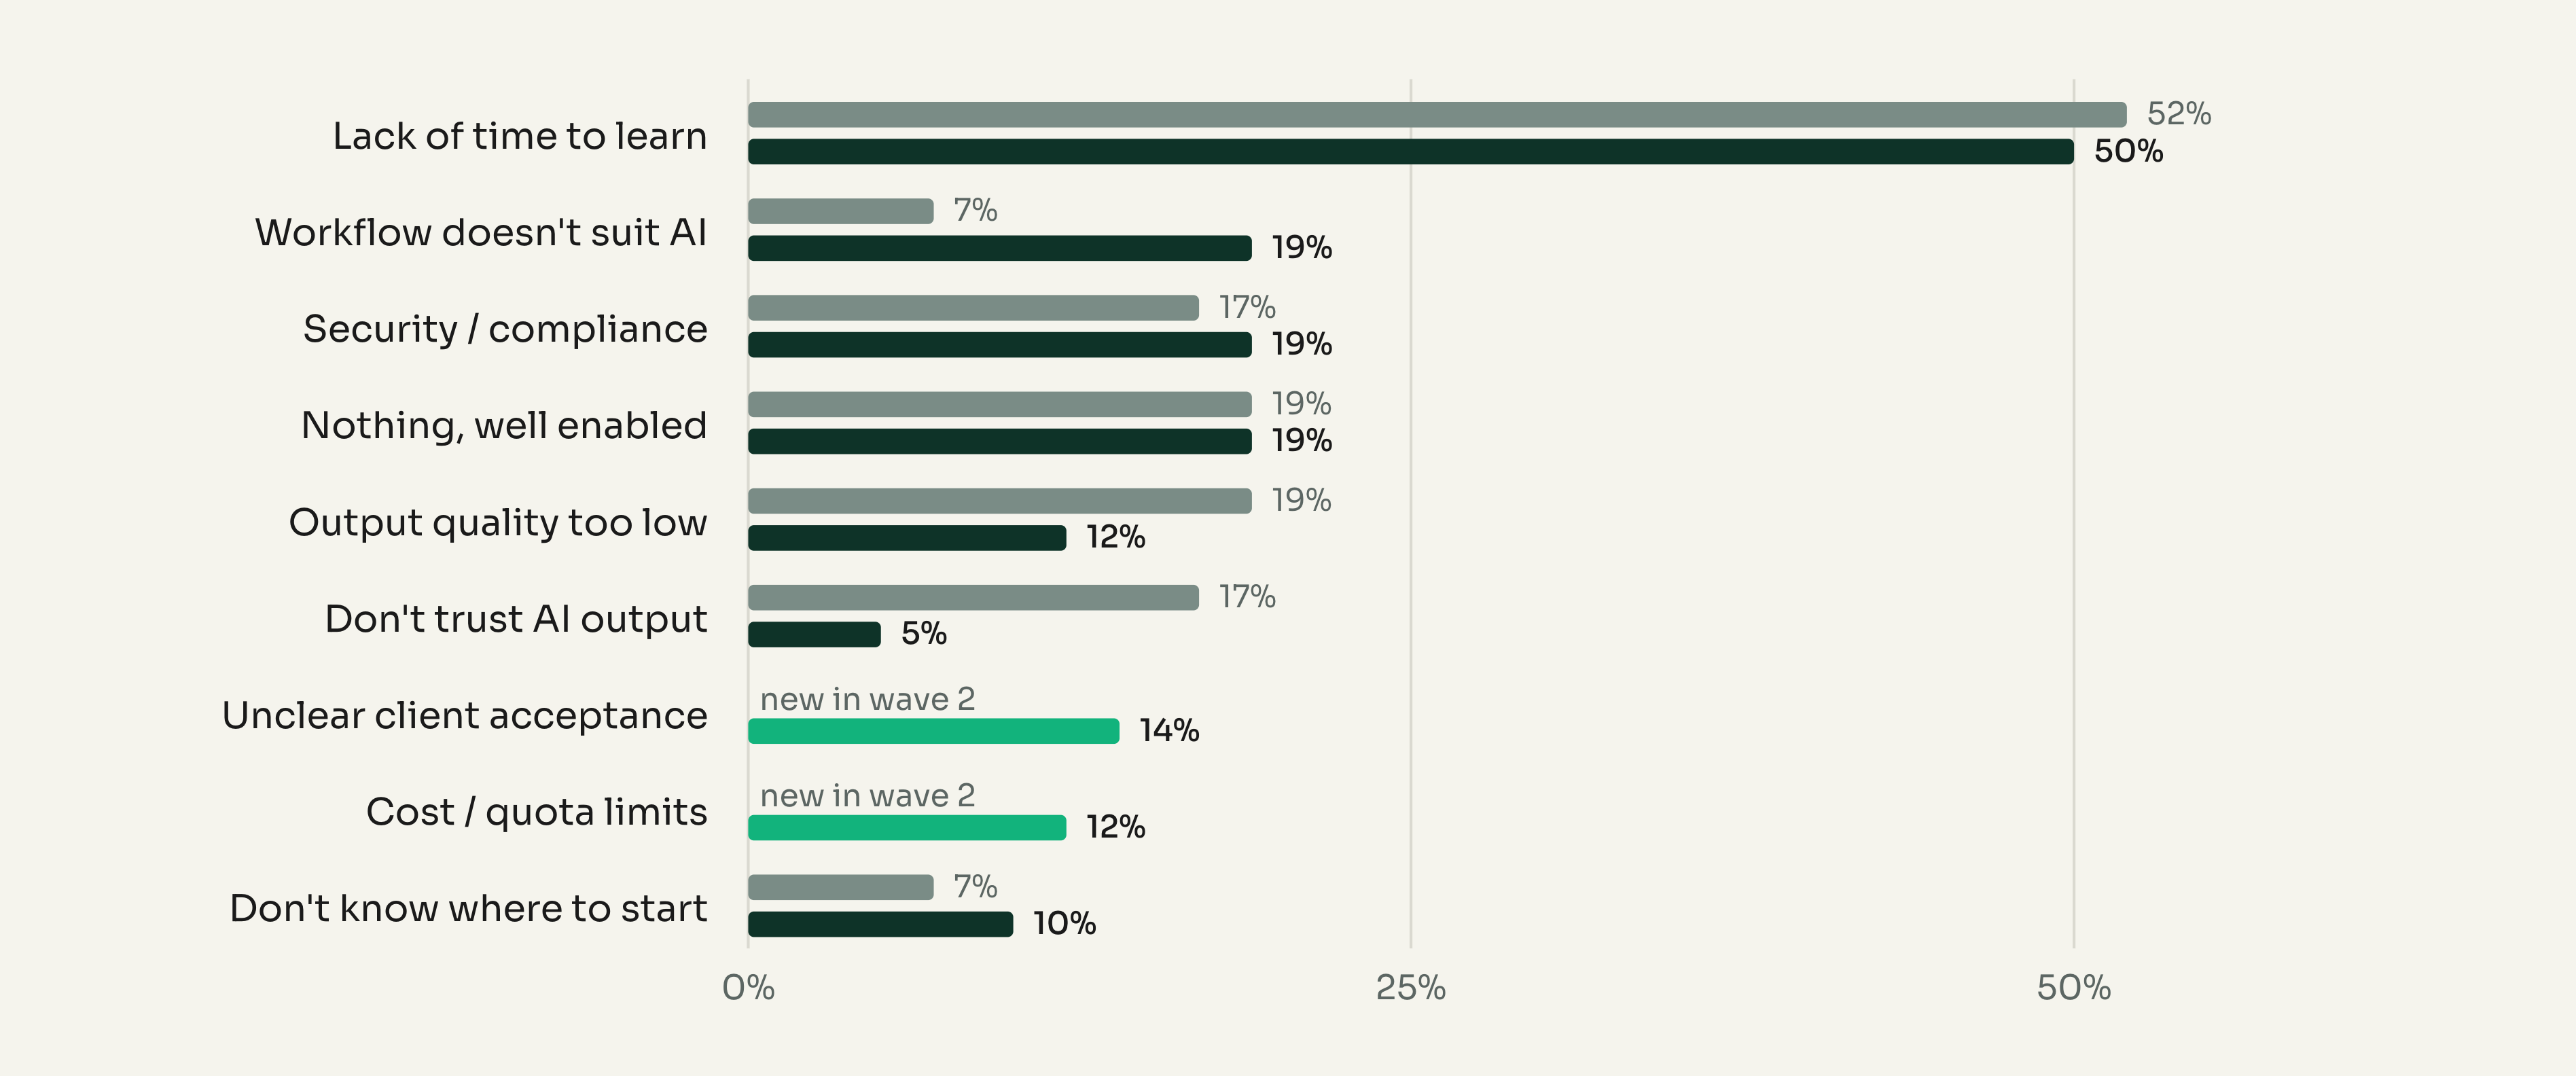
Lack of time is the one constant across both waves, at roughly half the team. It is the only barrier that has not moved at all.
11 — New in wave 2: no baseline exists.
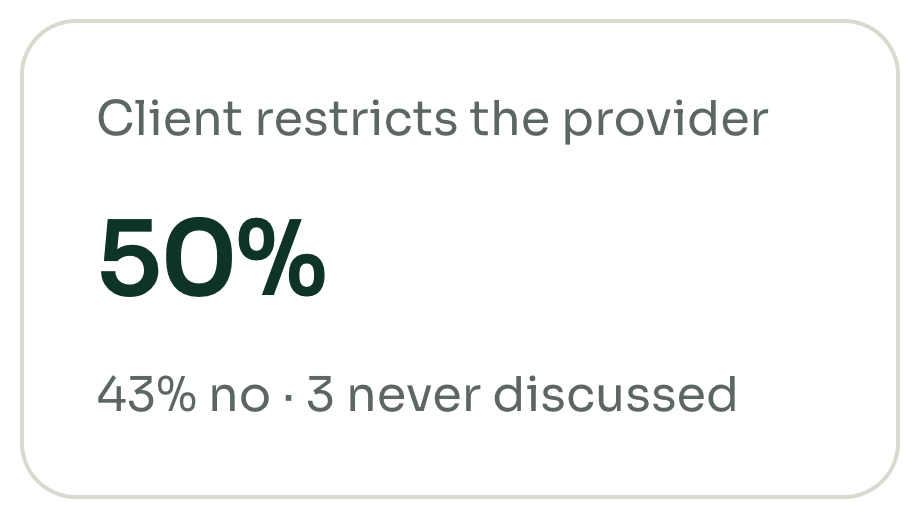
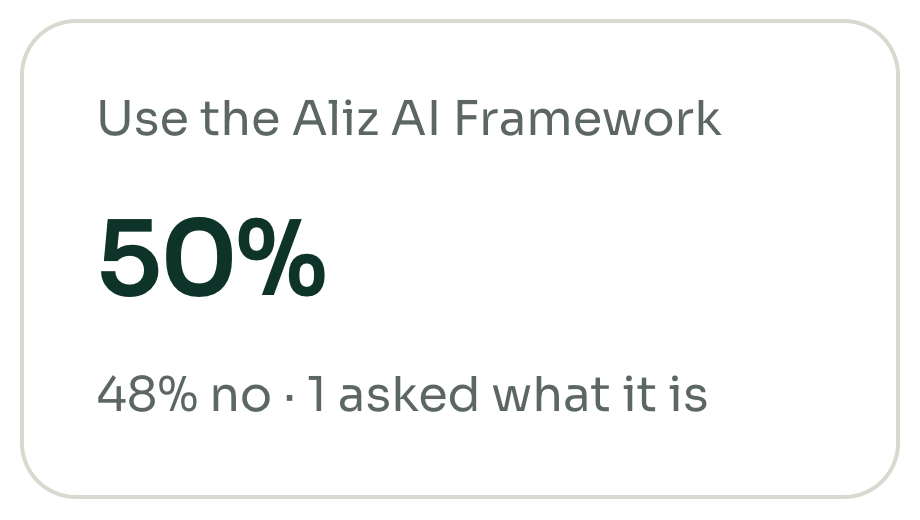
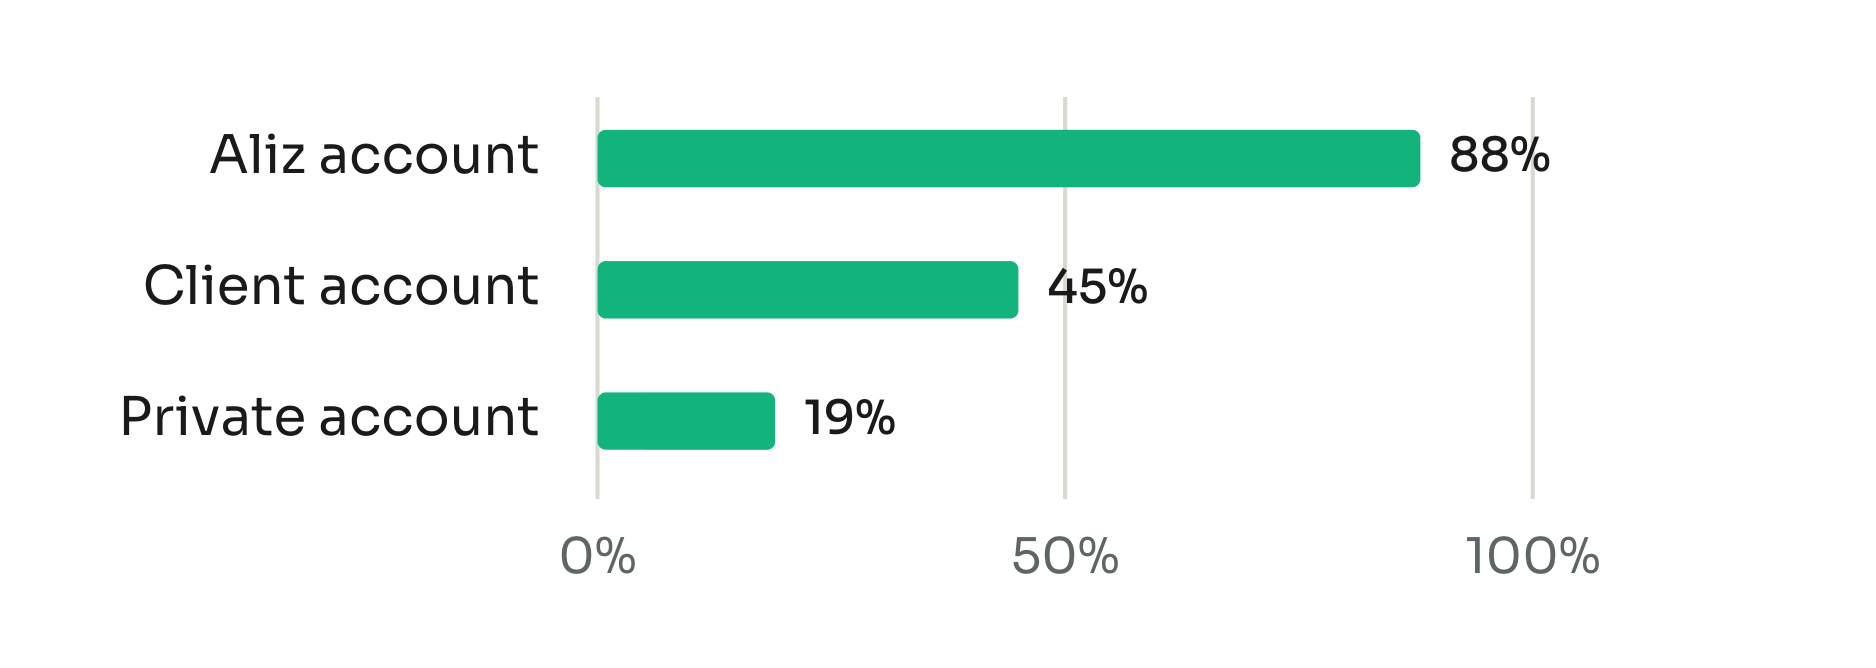
Five questions were added. Everything in this section is a first reading with nothing to compare against, so treat these as the wave 3 baseline rather than as a trend.
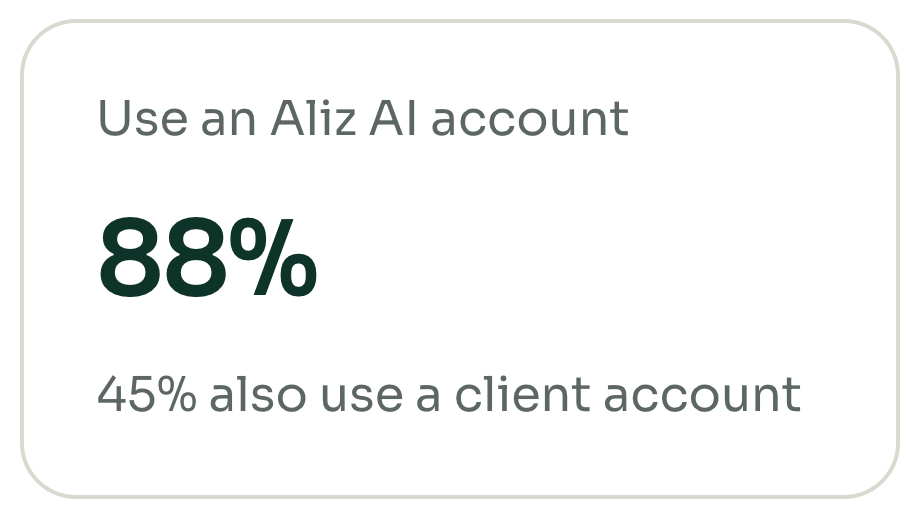 |  |  |  |
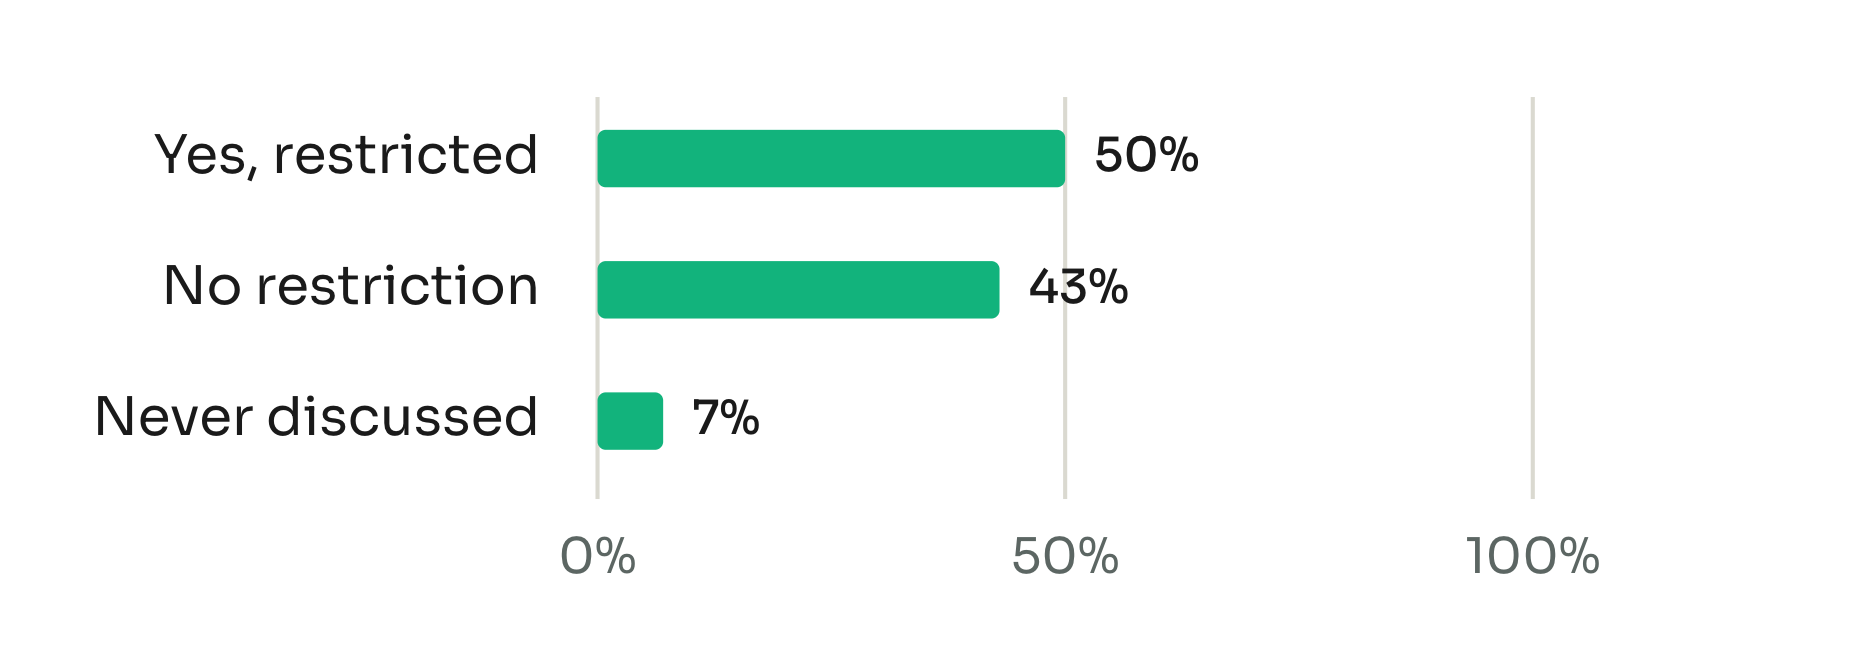
| Whose AI account is used | Client provider restriction |
|---|---|
 |  |
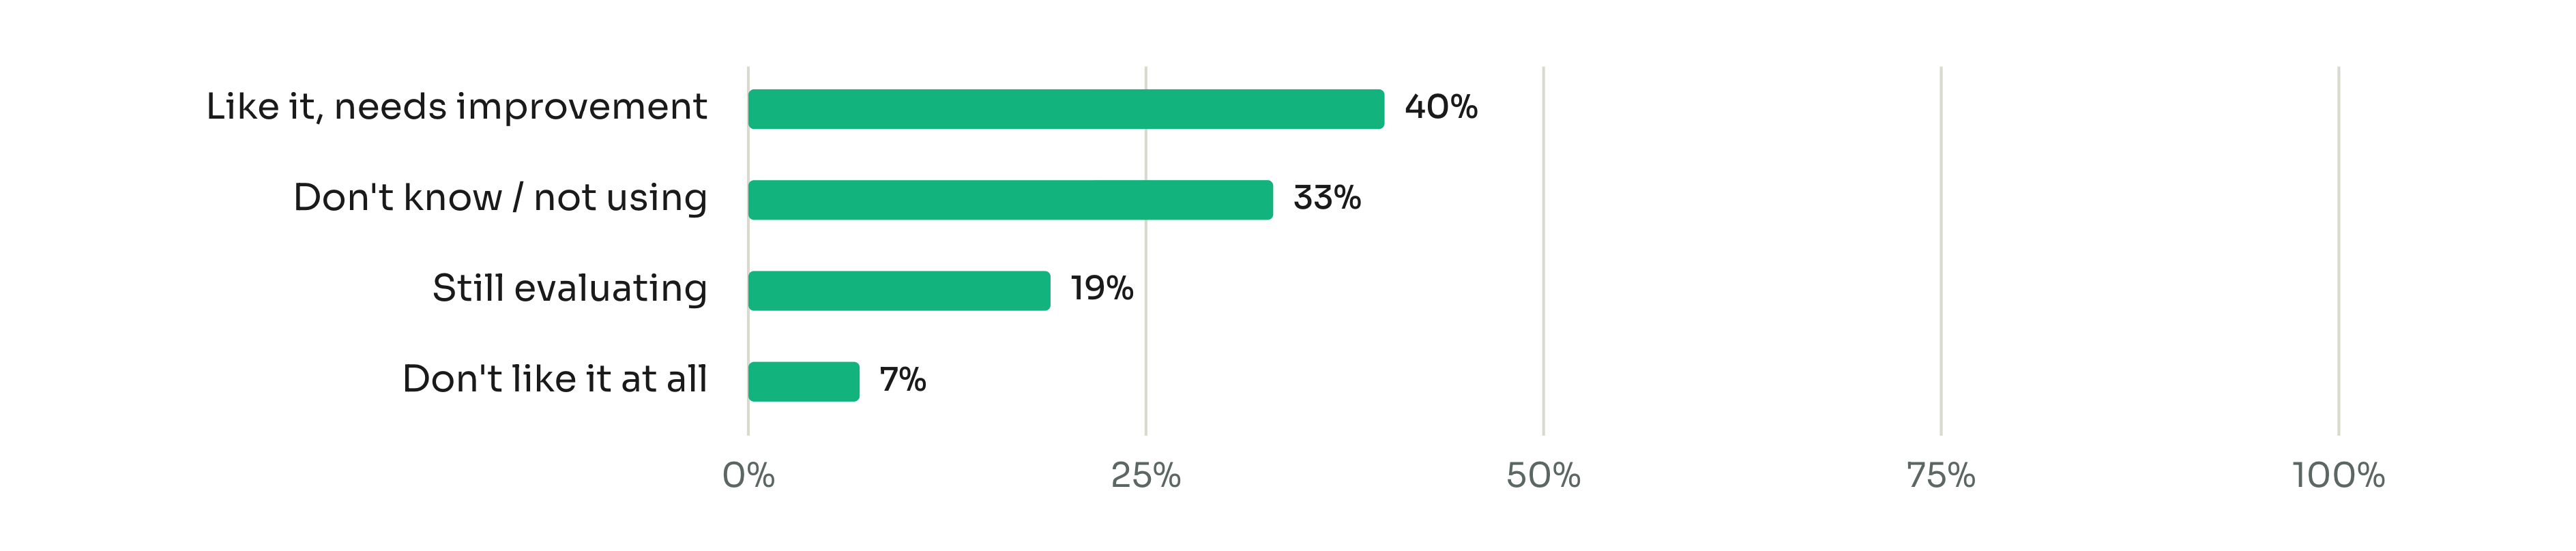
What people think of the Aliz AI Framework
"Using AI we can generate this much more value" (1–10)
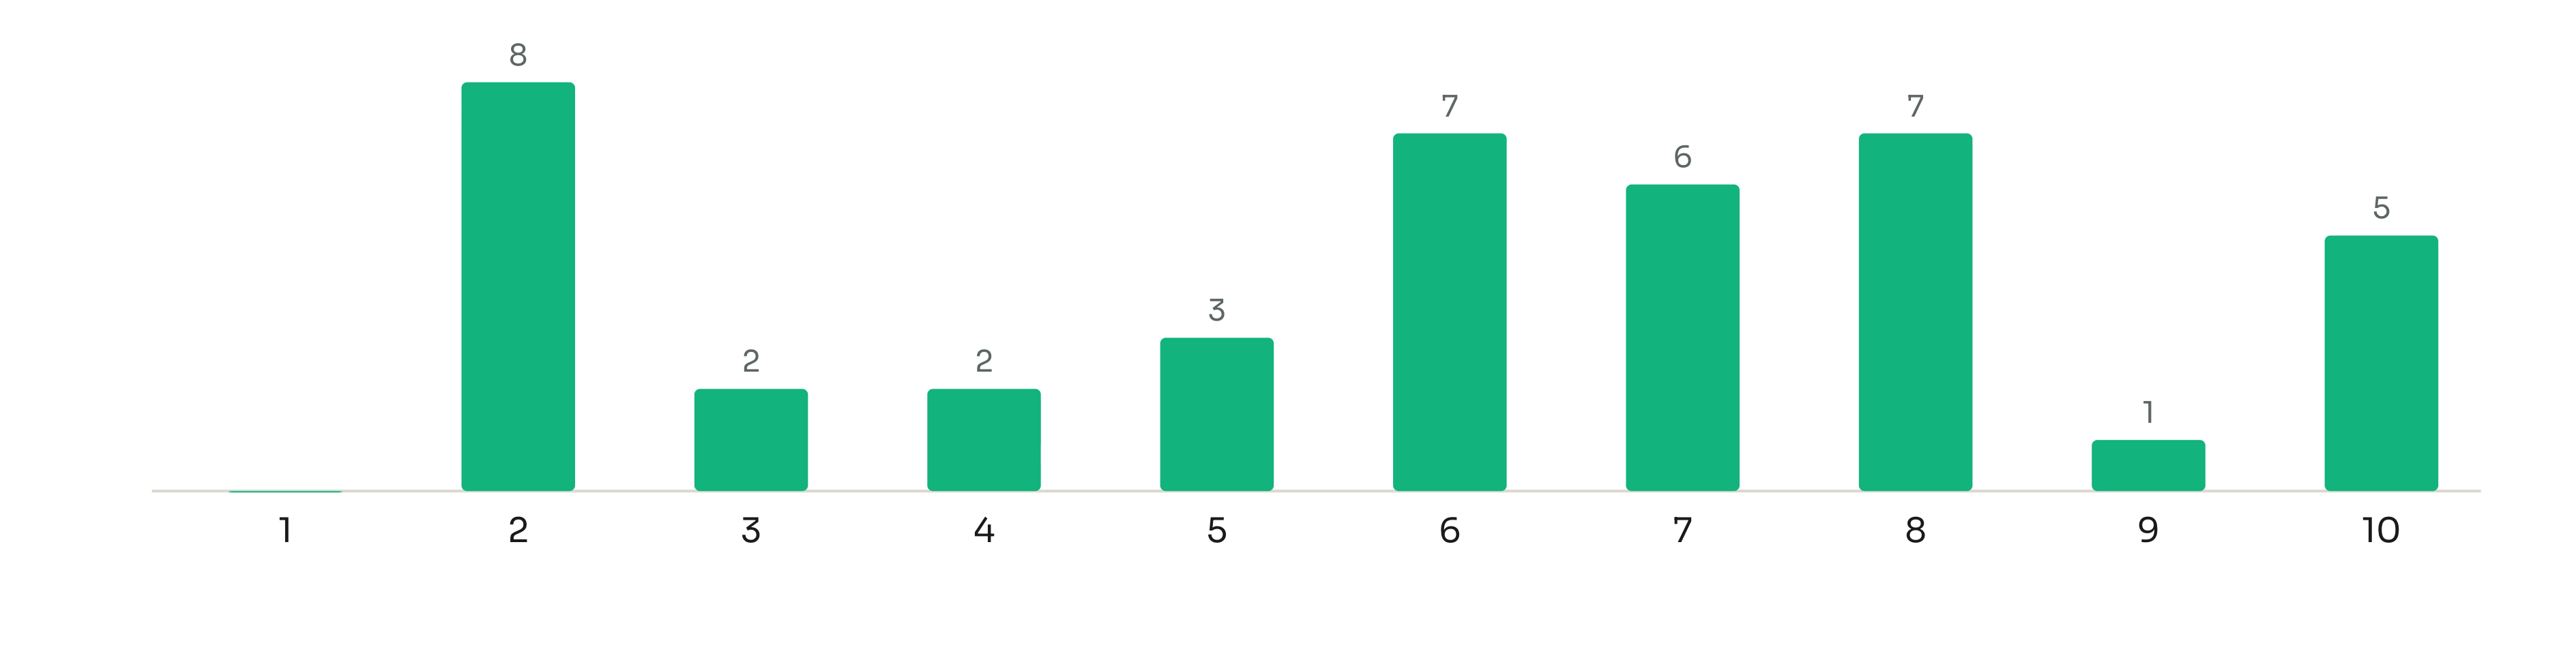
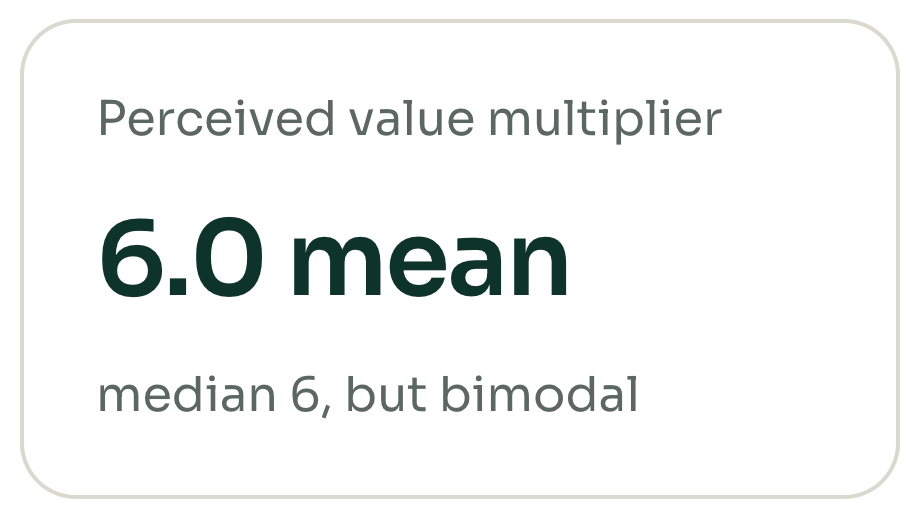
The value question is bimodal, not centred. Eight people answered 2, five answered 10. The mean of 6.0 describes almost nobody. There are two populations here with incompatible views of what AI is worth, and averaging them hides the disagreement.
Compiled from the two Google Forms response sheets. 42 responses per wave. Wave 1 fielded 13–23 March 2026, wave 2 fielded 20 July – 30 July 2026. Percentages are of all respondents in that wave; multi-select questions sum above 100%. Free-text answers were coded into the nearest offered option where unambiguous and left out of the counts where not.
aliz.ai